
Inventory management is critical for any business. In fact, companies that sell tangible products, revolve around the management of their inventory. That management is not just about removing items from a shelf and restocking it. Rather how organized their characteristics are by evaluating them, and, based on that evaluation, how they are market. An optimized inventory process, powered by intelligent strategy and technology, is extremely important.
That is where the concept of inventory turnover is introduced. Knowing how to calculate inventory turnover is paramount for any business. This guide explains what inventory turnover is, and how you can do inventory tweaks with Regression algorithms to more effectively manage your stock.
What is Inventory Turnover?
Inventory turnover is the amount of inventory or stock sold in a given period of time. Being aware of your company’s inventory turnover provides valuable insights into what products are best sellers how many funds should be redirected towards supply.
Reduce inventory turnover with Machine Learning and Regression analysis
Inventory turnover ratio (ITR) is an activity ratio and is a tool that evaluates the liquidity of a company’s inventory. It measures how many times a company has sold and replaced its inventory during a certain period of time.
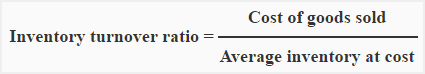
Manually, ITR is computed by dividing the cost of goods sold by average inventory at cost. The formula/equation is given below:
After finding out your inventory turnover, it would be useful to know what products will need to be put back in stock, hence reducing the ITR. That’s where Datagran comes in. It predicts which products should be restocked, helping you lower the ITR based on your data.
You will build a regression model using the Decision Tree algorithm. And for each sample store, you will know the quantity of each product that will need to be re-established so you can predict your inventory before even starting to sell your products.
The first step is to connect your data sources to Datagran.
If you don’t already have one, sign up for a Datagran account. Then select your workspace (or create a new one), add a project, head over to Integrations, and click on Add Integrations to connect any data source you need from the list available.
New to Datagran? Check out this video to learn more about Integrations and how to set them up.
If you haven’t connected your data source yet, click on the plus sign to add an integration, and select the one you wish to integrate. Datagran will then ask you to choose the streams of information you want to pull from your data.

Streams of information are the type of data collected from your store, so in this case, you want to make sure you select streams relevant to your inventory. For example, you’ll want to pull information regarding products, invoice tickets, frequency of purchase, variables, etc. You will then be asked how often you want it to pull data from your data source—select DAILY as your frequency.
Create a Machine Learning pipeline to test, train and predict based on your data
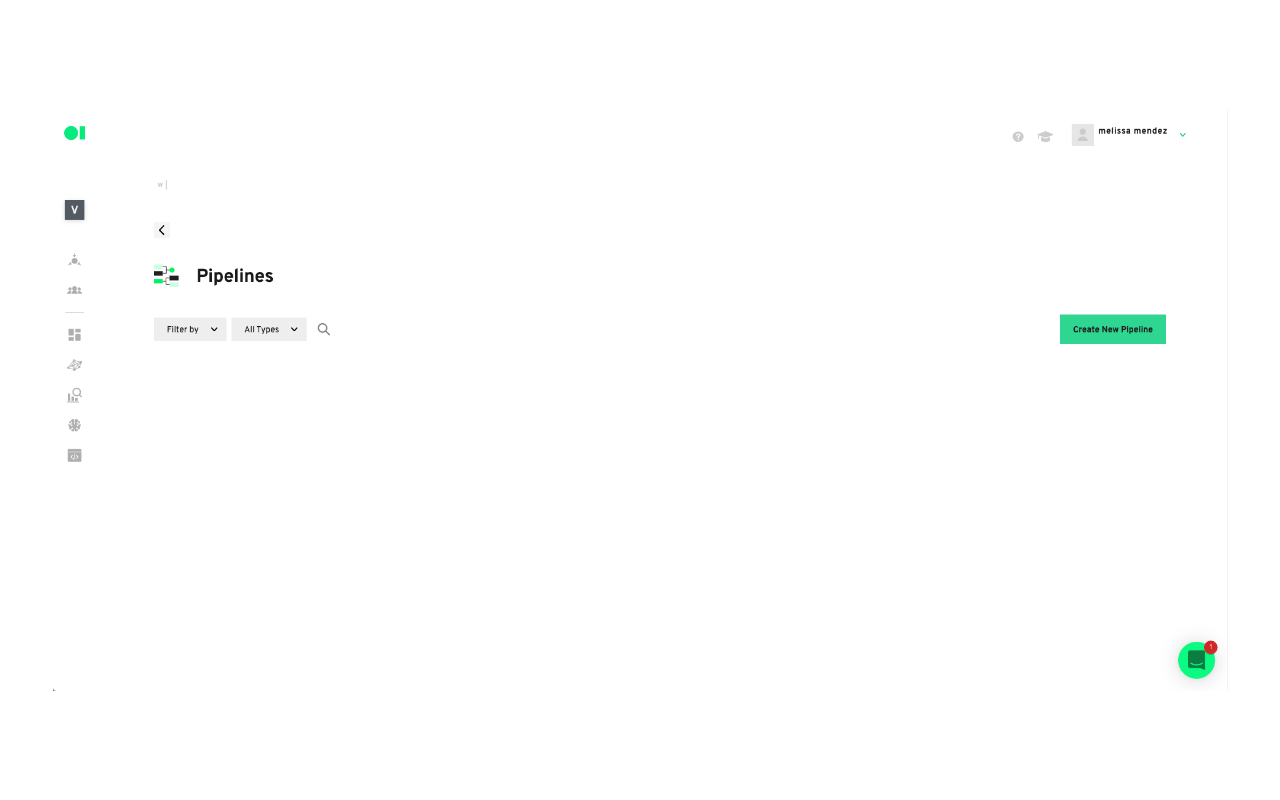
Now that Datagran has your data, it’s time to turn it into an ML pipeline where you will build a regression model using the Decision Tree algorithm. To do that, you’ll need to make a new Pipeline—the automated workflow—and add the data sources you want to extract information from. In this example, we are using BigQuery.
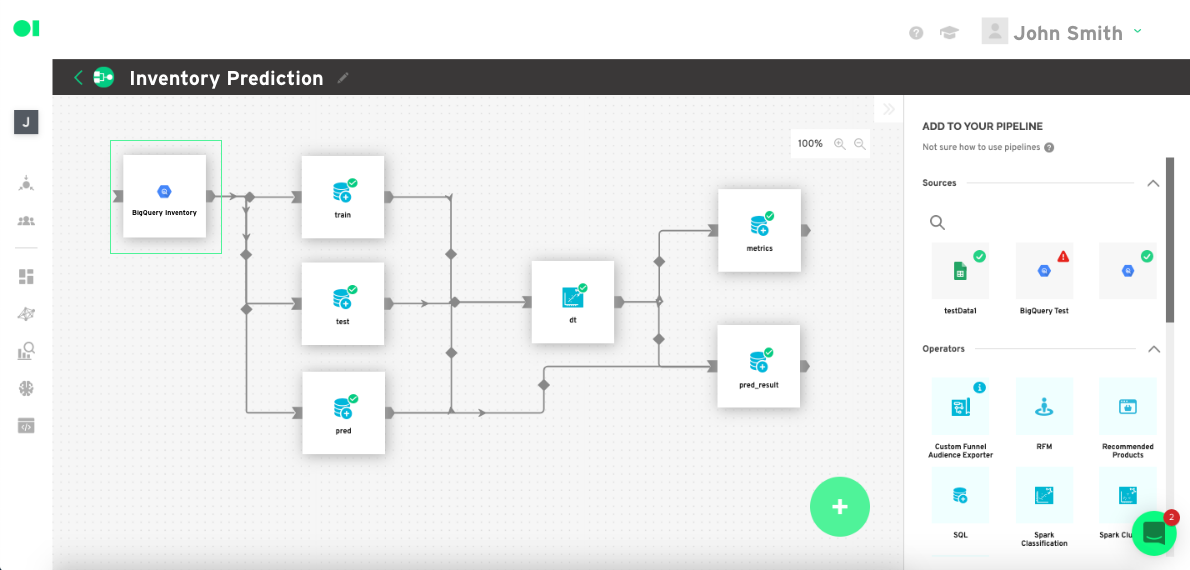
From right sidebar drag and drop the sources, in this case the BigQuery server data, then drag and drop a Custom SQL Operator to tell the operator what information to extract from your data sources. Click the Edit button, select the source and copy and paste the sample query below. In this tutorial, you will identify products by ID, location, date, time, and price. Make sure you replace the values with your own values so the query runs correctly.
To learn more about operators, watch this video.
Tip: We suggest using 80% of the data set for training, and 20% of the data set for testing.
Test sample query:
SELECT
DATE(CAST(date_updateorder AS TIMESTAMP)) AS date_updateorder,
CAST(id_store AS INT64) AS id_store,
CAST(company_id AS INT64) AS company_id,
CAST(id_newproduct AS INT64) AS id_newproduct,
CAST(id_unidad_medida AS INT64) AS id_unidad_medida,
CAST(cantidad_product AS FLOAT64) AS cantidad_product,
CAST(marca AS INT64) AS marca,
CAST(canal AS INT64) AS canal,
CAST(special_day AS INT64) AS special_day
FROM
`Bigquery__ds_vtasdetails`
WHERE
RAND() <= 0.9
Run the query and save the table.
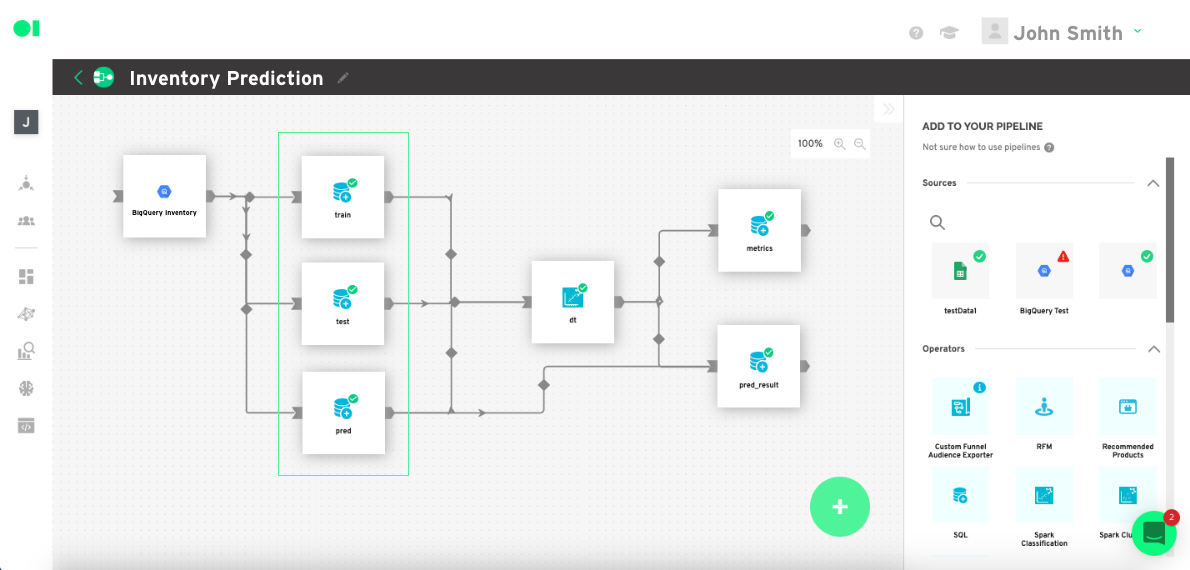
Now go back to the pipeline, press the play button to run the SQL operator by hovering over it. Then, add three more SQL operators to test, train and predict from your data.
Train:
To train the model you need a set of data to train the algorithms (train dataset). If you want to evaluate the model, you need a set of test data (test dataset), although it is not mandatory. And finally, the objective is the output of the model (100% of the data set), the values you want Datagran to predict. For this, it is necessary to have a dataset for prediction (predict dataset).
Hover over the first operator element which will be named Train and press the edit button. The SQL query editor page will pop-up where you can choose what columns to pull from your data.
Copy and paste the query example below and replace each variable to apply to your table’s variables, or press the Show Editor button located on the top right-hand corner to choose the columns without having to add code. Then, run the operator.
SELECT
DATE(CAST(date_updateorder AS TIMESTAMP)) AS date_updateorder,
CAST(id_store AS INT64) AS id_store,
CAST(company_id AS INT64) AS company_id,
CAST(id_newproduct AS INT64) AS id_newproduct,
CAST(id_unidad_medida AS INT64) AS id_unidad_medida,
CAST(cantidad_product AS FLOAT64) AS cantidad_product,
CAST(marca AS INT64) AS marca,
CAST(canal AS INT64) AS canal,
CAST(special_day AS INT64) AS special_day
FROM
`Bigquery__ds_vtasdetails`
WHERE
RAND() <= 0.1
Predict:
SELECT
DATE(CAST(date_updateorder AS TIMESTAMP)) AS date_updateorder,
CAST(id_store AS INT64) AS id_store,
CAST(company_id AS INT64) AS company_id,
CAST(id_newproduct AS INT64) AS id_newproduct,
CAST(id_unidad_medida AS INT64) AS id_unidad_medida,
CAST(cantidad_product AS FLOAT64) AS cantidad_product,
CAST(marca AS INT64) AS marca,
CAST(canal AS INT64) AS canal,
CAST(special_day AS INT64) AS special_day
FROM
`Bigquery__ds_vtasdetails`
WHERE
RAND() <= 0.9
ORDER BY
1 DESC
LIMIT 10
Run the SQL operators
For all three SQL elements to activate the play button must be pressed. Simply hover over each element to find it.
Connect the Spark Regression algorithm
Drag and drop the Spark Regression algorithm into the canvas. Connect all the operators to it and open its settings by hovering over the Spark element and pressing the Edit button. Choose the options from each dropdown menu and save them when you’re done. Go back to the canvas a run the algorithm by hovering over the Spark Regression element and pressing the play button.
Send the ML model results to production
You can either export your model’s result to a CSV table, send it to a business app like Salesforce, Slack, etc or send the results to a chart for easy visualization.
Play to run your pipeline. This will begin running your workflow daily, extracting information from your data source, training, testing, and predicting, as well as applying the Decision Tree algorithm.
Make a chart to visualize your results
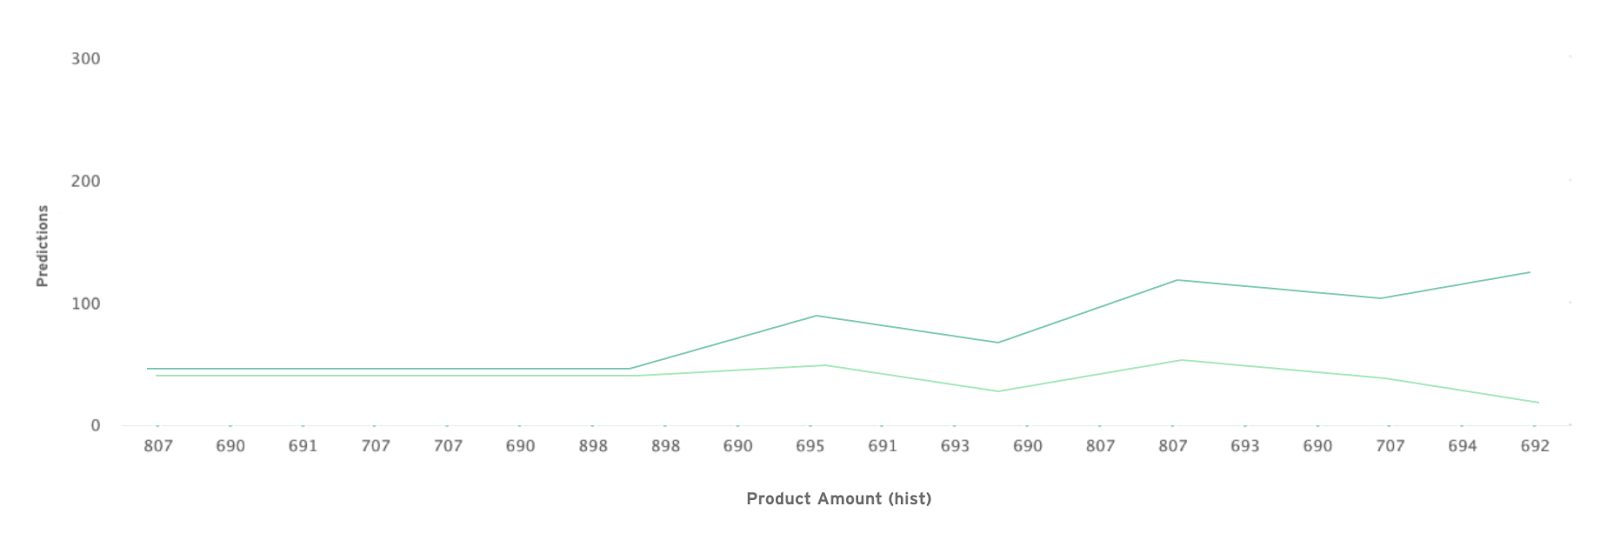
The charts provide detailed information about your inventory such as the difference between the ITR prior to doing the prediction model and after doing it. You should expect to have a lower ITR once the predictions have been executed.
The analysis can be carried out using the ITR additionally, in order to verify the model. Note there could be a margin of error. Testing should be done with real data to compare how much was spent on inventory historically, against how much is proposed to be spent after the prediction and the ITR calculation. It should be expected for the previous ITR to be higher than the new predicted ITR as shown below in the chart.
With this data, it is easier and faster for your teams to define inventory levels. Speed is a key factor when it comes to supply chain management. Due to market trends, companies must have a fast-paced system in place to understand what their customers want, while keeping the inventory turnover ratio low. This is a simpler use case of how to find inventory data, but if you require more advanced pipelines involving more data sources, algorithms, and actions, you can do so as well. Learn more about Datagran here.

.jpg)

