
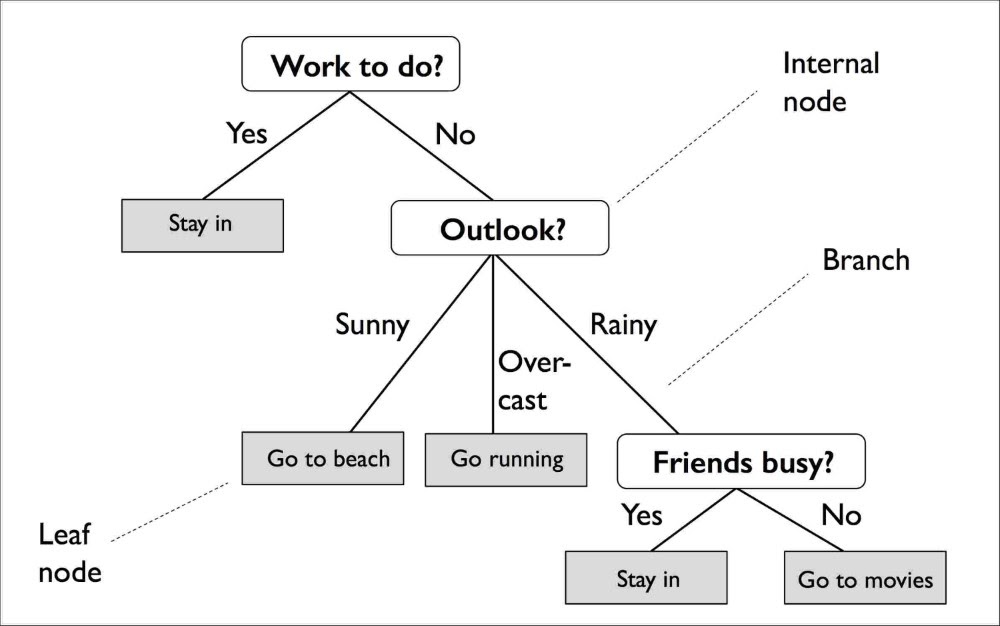
Suppose your business needs to predict the conversion rate of future Ad campaigns based on your Ad spend. To find it, you would first need to find a correlation between advertising spend and conversion. A Regression Model can do just that, applying what’s called a Decision Tree Regression Algorithm. This algorithm breaks down a dataset into smaller and even smaller subsets while an associated decision tree is incrementally developed. The result is a hierarchical tree with nodes and leaf nodes.
In statistical modeling, Wikipedia states that Regression Analysis is a set of statistical processes for estimating the relationships between a dependent variable (often called the 'outcome variable') and one or more independent variables (often called 'predictors', 'covariates', or 'features').
If you put all of this together, you know that to find the amount of money needed to reach X number of conversions, you would need to spend Y amount of money. And to find it, you must build and run a Regression Model using a Decision Tree Regression Algorithm. The problem is that either you don’t have the team and the tools to make this happen, or you do have the team, but lack the tools that can help you test and iterate quickly in order to avoid spending bandwith your team could otherwise use by implementing other models. With Datagran, teams can quickly test, iterate and send models to production so that stakeholders can take action in a timely manner. It’s paramount to understand that in today’s world, companies need to make decisions today, not tomorrow, next week or next month.
The following step-by-step tutorial will walk you through the process of running a Regression Model fast, with low code.
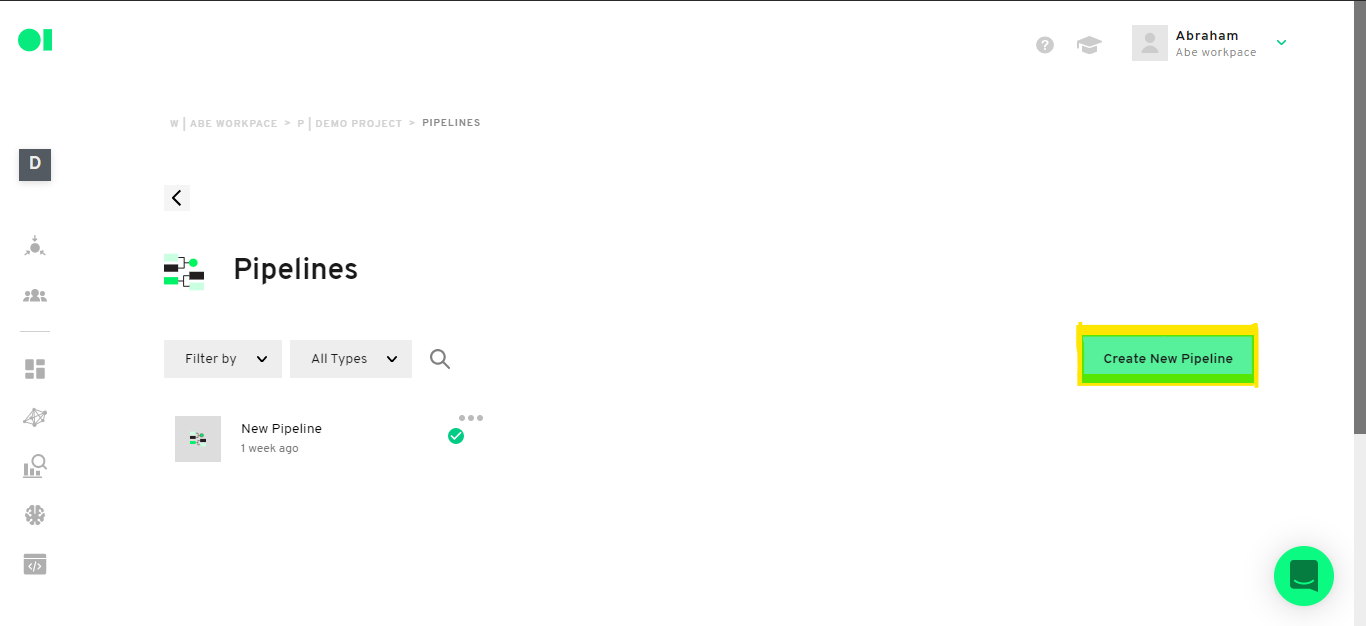
Step 1: Create a Pipeline
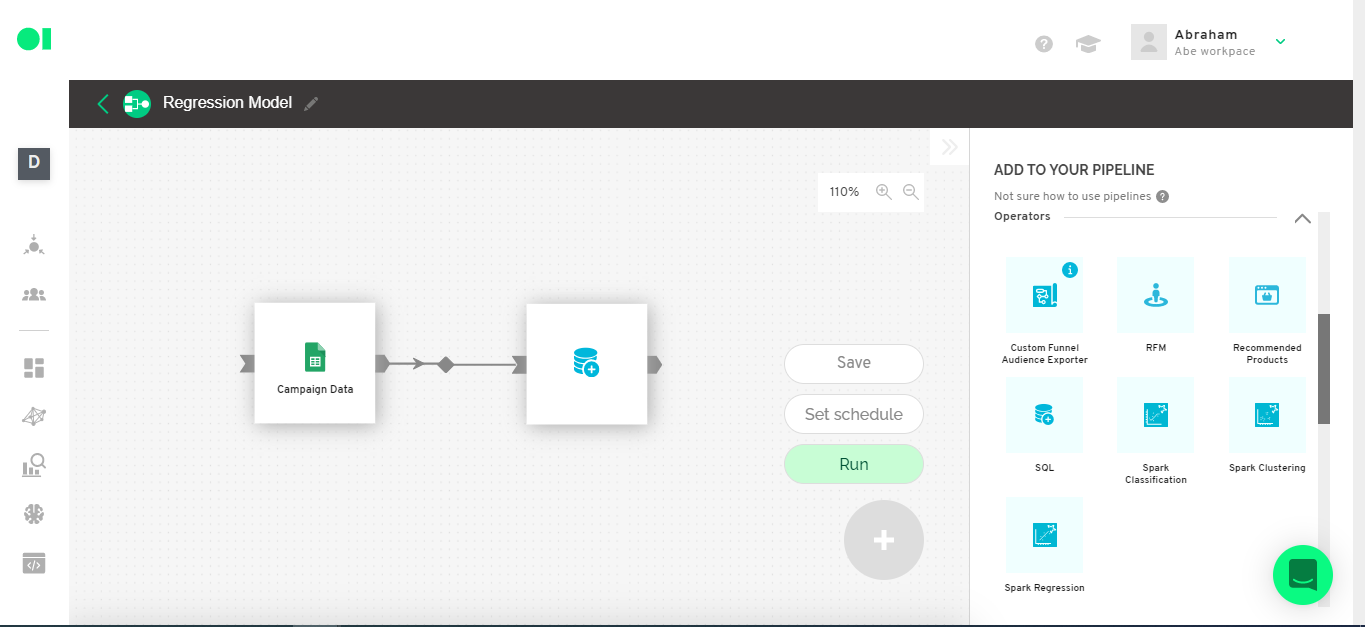
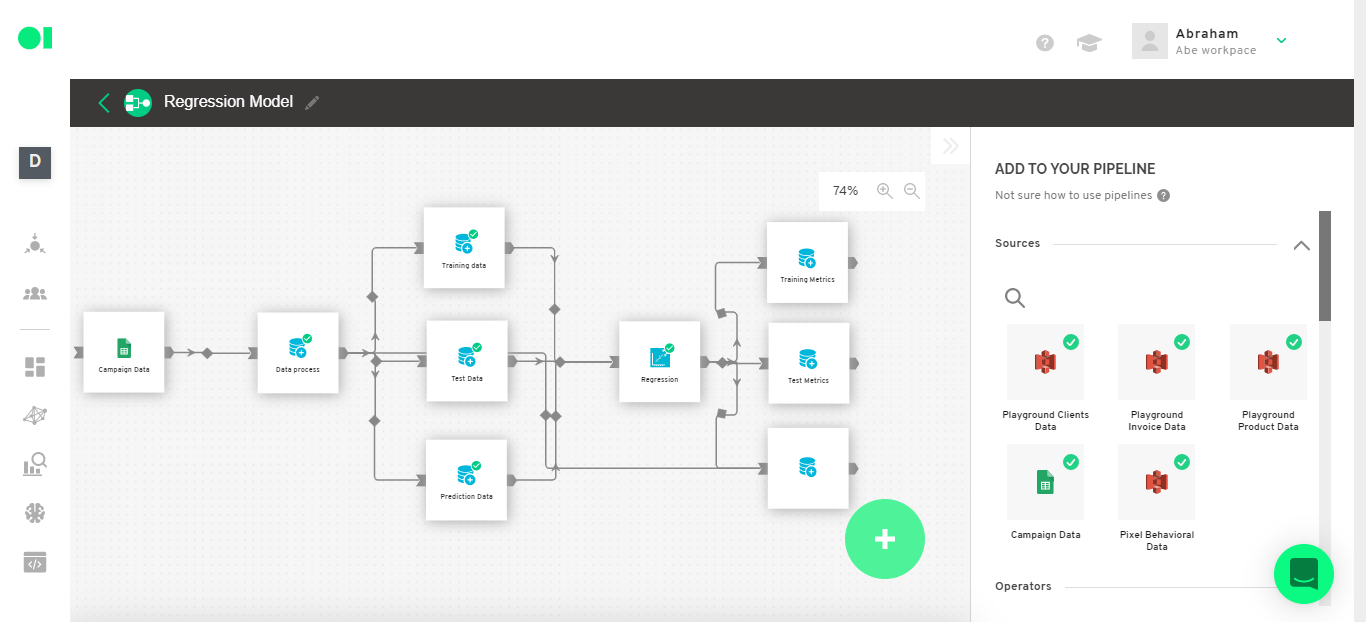
After your desired data sources have been integrated into Datagran, you can create a new pipeline.
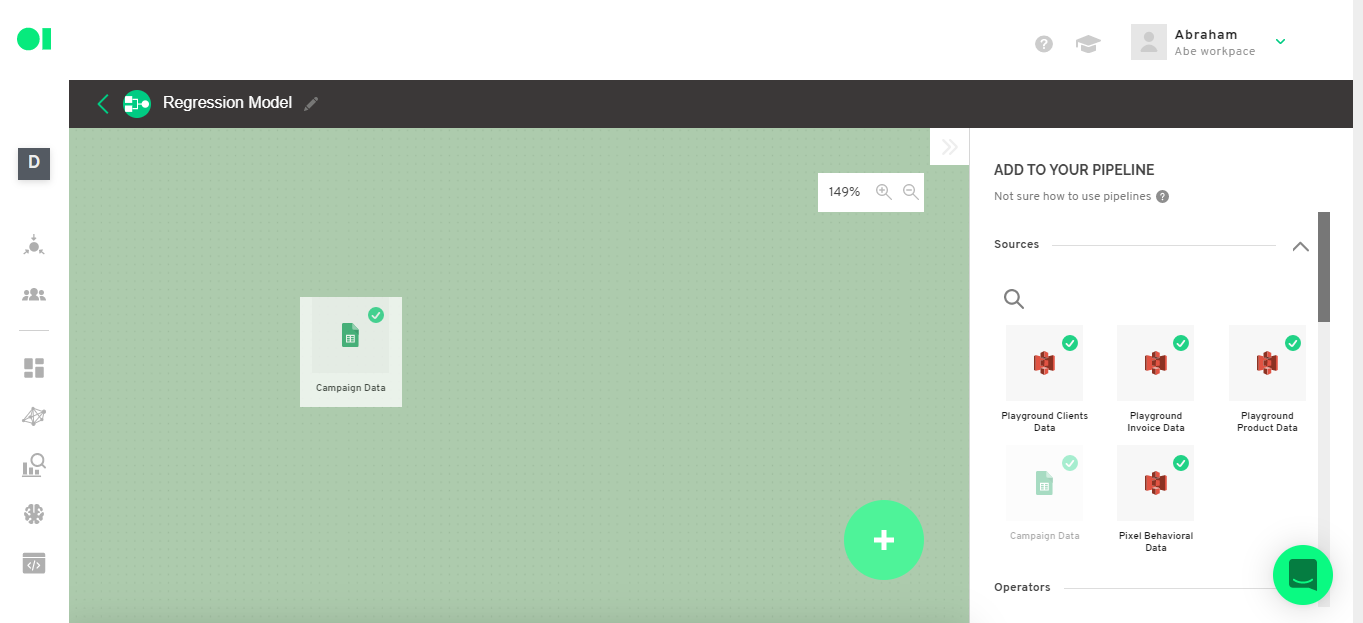
Step 2: Select your data sources
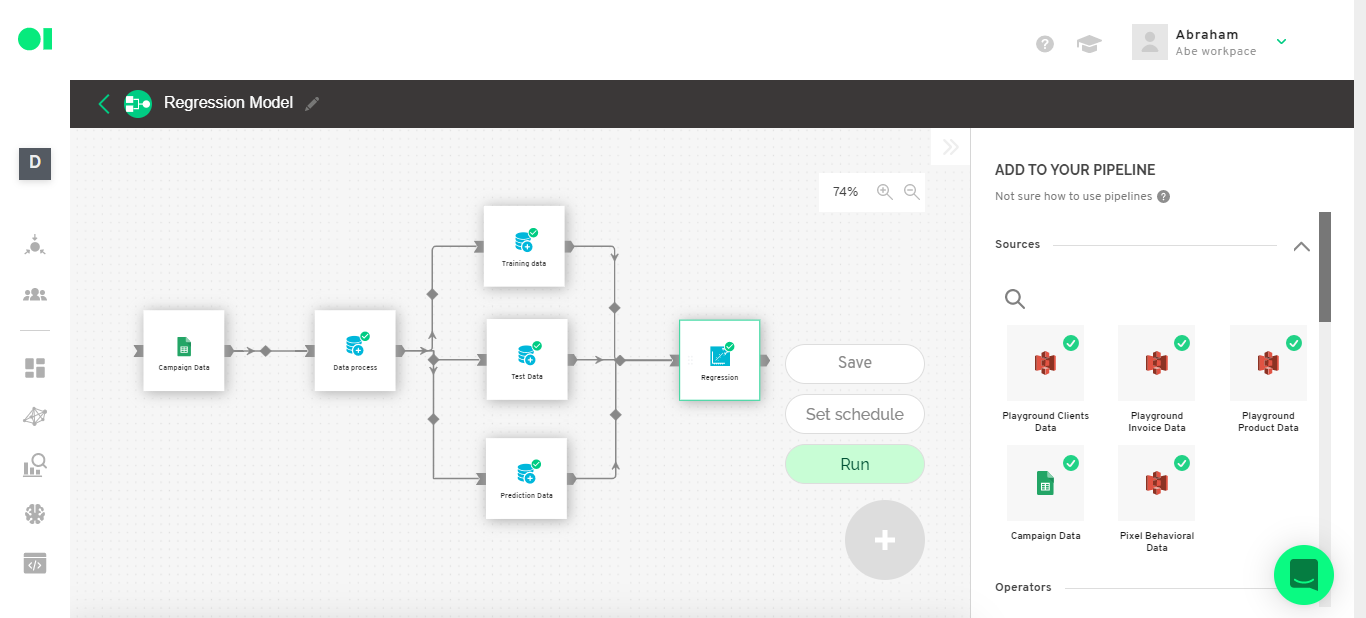
From the right hand side menu, drag and drop the source you want to use to run the model. Make sure you name your pipeline.
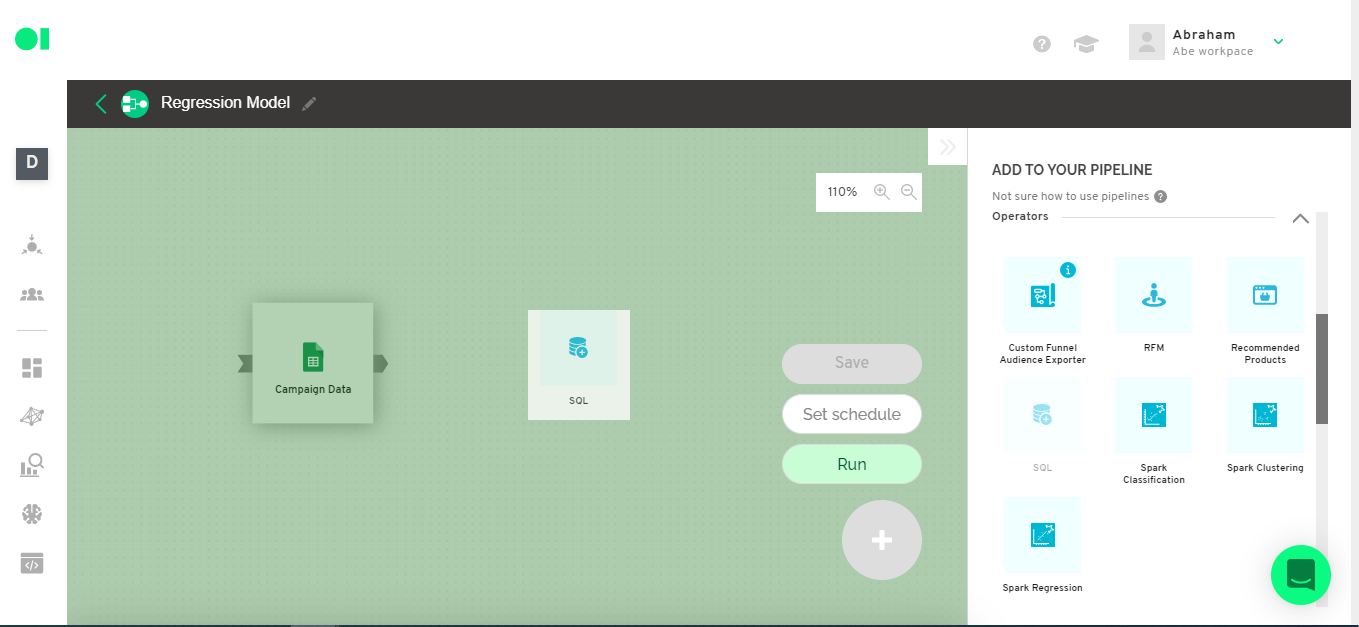
Step 3: First step to prepare your dataset
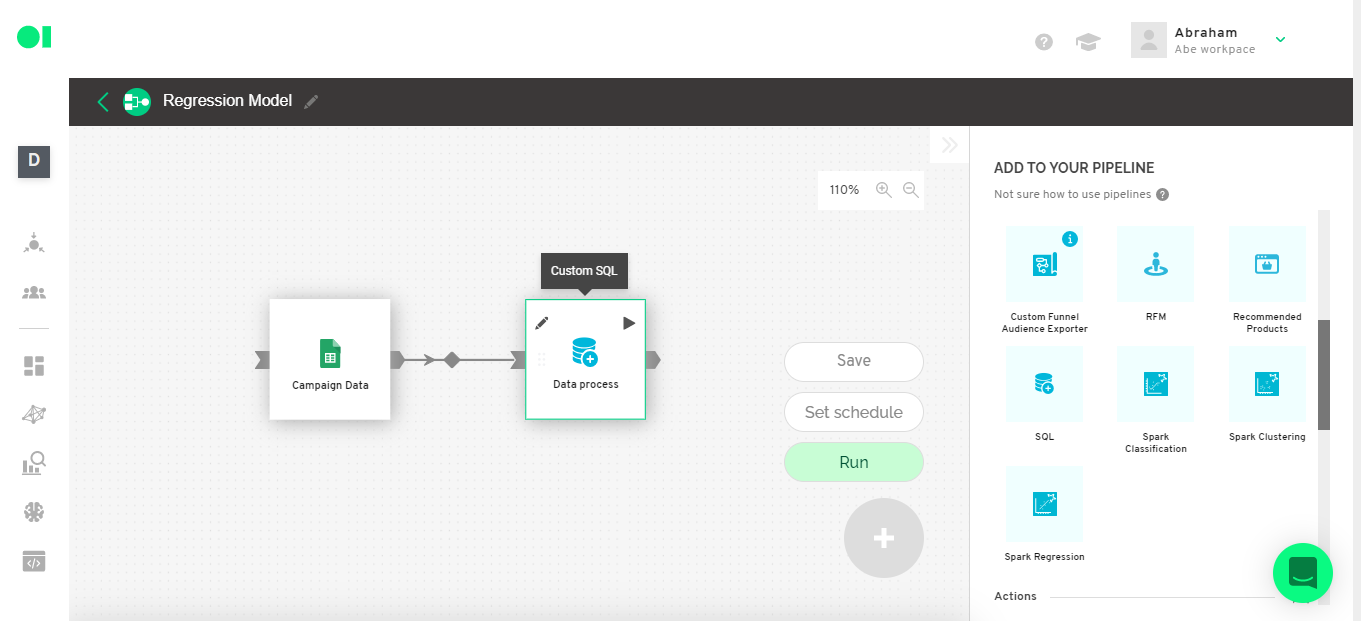
Connect an SQL operator to the source you already added by dragging and dropping the element located in the right-hand side menu.
Step 4: Second step to prepare dataset
Check if the data is in the correct format. To do so you must open the SQL operator and run the following query:
SELECT *
FROM `[Name of the table you are going to use]`
LIMIT 20
To copy our example use this query:
SELECT *
FROM `Campaign_Data__hoja_1`
LIMIT 20

Step 5: Third step to prepare dataset
Set your model’s goal (In this example, we want to predict the number of Ad Conversions using Ad Spend data).

Step 6: Fourth step to prepare dataset
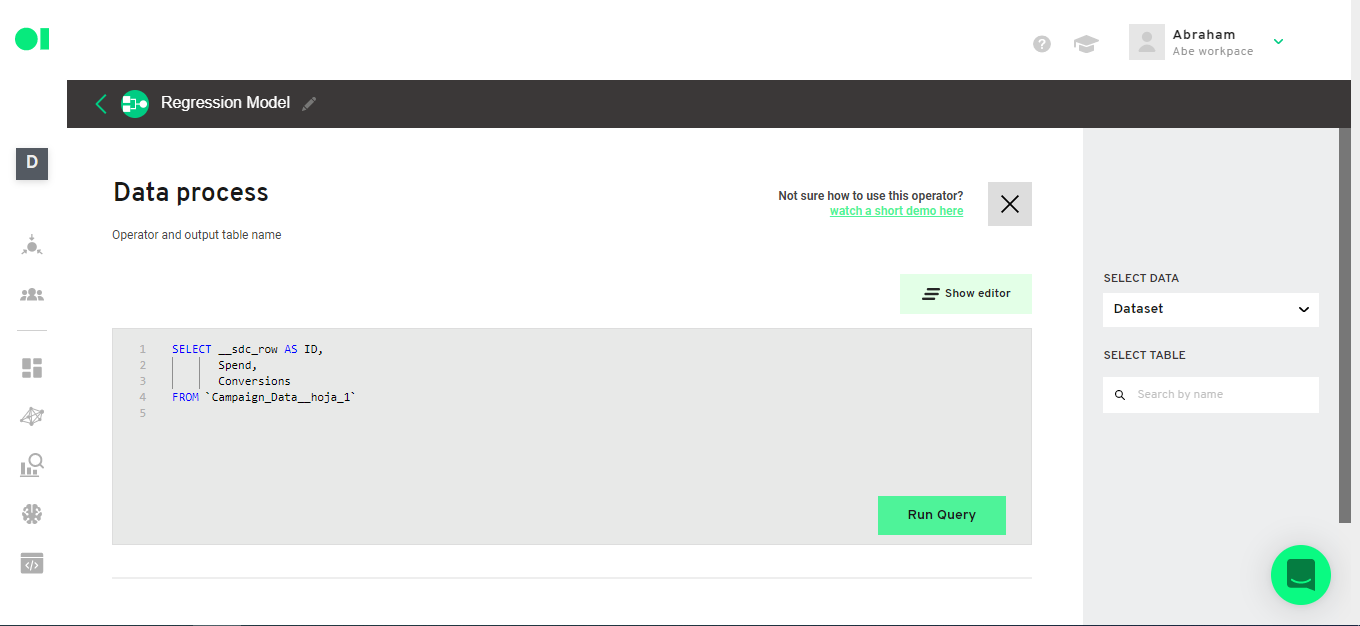
Preprocess your data and save your SQL Operator by clicking on the Save button.
In this example, we are going to create a new data set to select the columns we need, which are the ID (in this case we will use [_sdc_row] as ID), [spend] and [Conversions]. We have to change the query in order to have the complete data set instead of 20 rows.
Run the query and save it.
SELECT [ID Column],
[Independent variable],
[Dependent variable]
FROM `[Name of the table you are going to use]`
To copy this example use this query:
SELECT __sdc_row AS ID,
Spend,
Conversions
FROM `Campaign_Data__hoja_1`
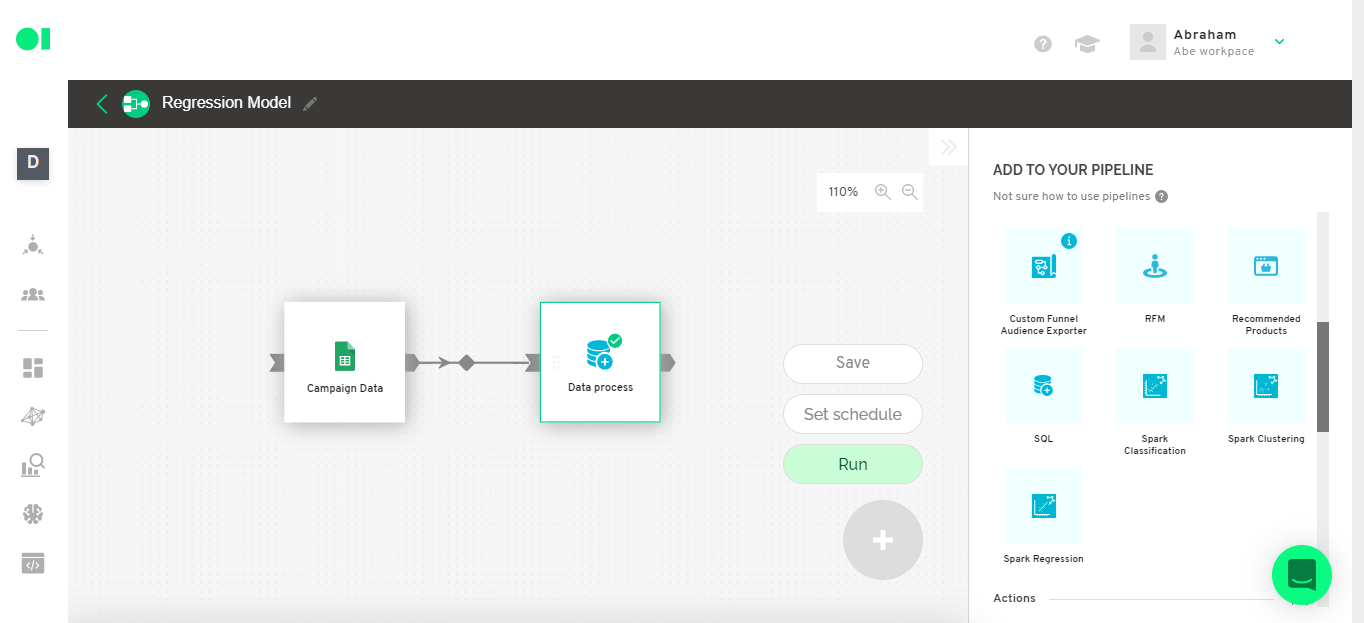
Then run the operator by hovering over the operator element and clicking on the Play icon. Once it completes the process a green checkmark will appear.
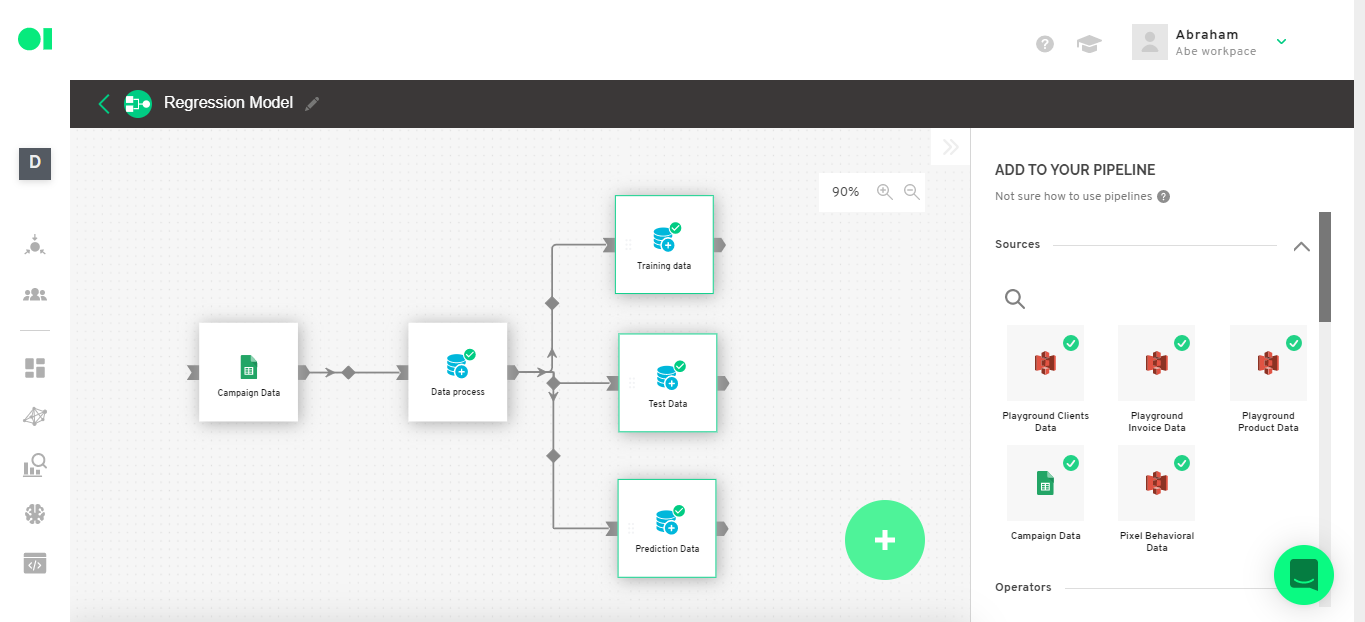
Step 7: Data set separation
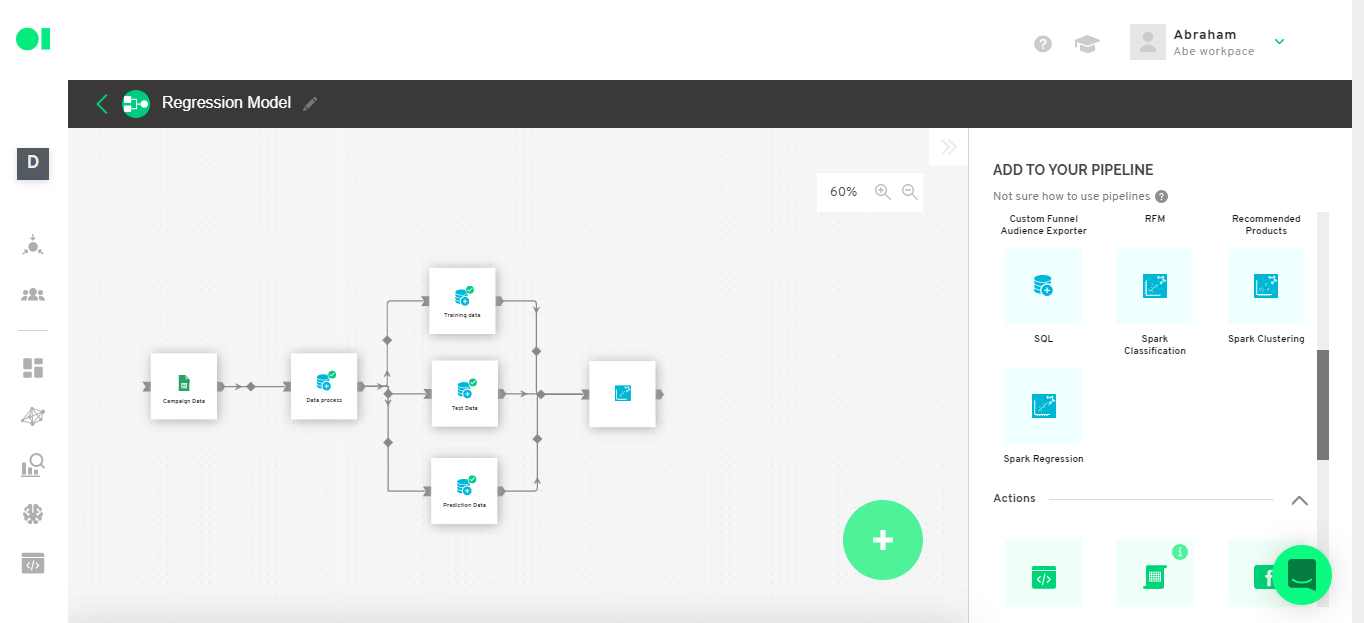
Split the dataset into Training, Test, and Prediction data.
The training data is the amount of data we are going to use to train the model. For this example, we are going to use 80% of the original dataset.
The test data on the other hand, is the amount of data we are going to use to test the already trained model. For this example we are going to use only 20% of the original dataset.
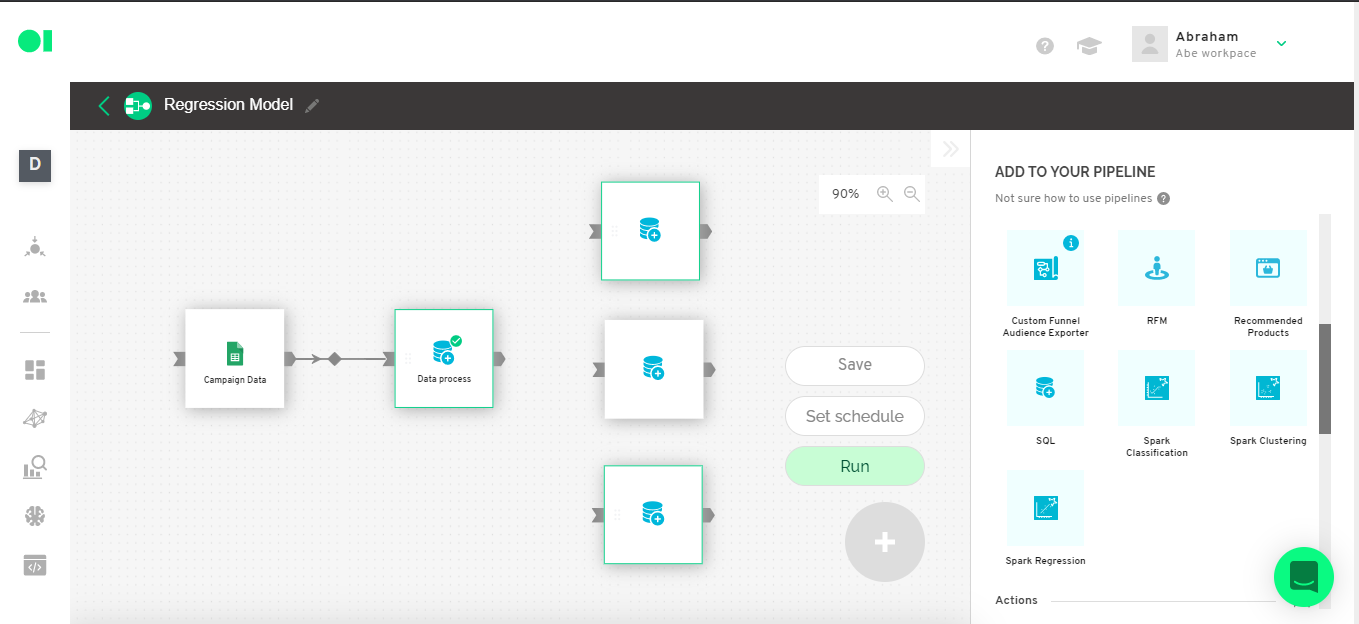
The prediction data is the data we will use to compare and validate the predictions of the model. And for this example, we are going to use the last 5 records of the data from the original dataset. In order to do so, we must create 3 SQL Operators and connect them to the original dataset.

Training dataset
Select just the 80% potion of the original data set. Hover over the first SQL and press the edit icon. Then copy and paste the below query into the SQL canvas.
SELECT *
FROM `operator_602faba34fc8704138f32cfc__sql_output`
WHERE RAND() < 0.8

Run the query and save it.
Test dataset
Select just 20% of the original data set. Hover over the second SQL element and press the edit icon. Then copy and paste the following query in the SQL canvas.
SELECT *
FROM `operator_602faba34fc8704138f32cfc__sql_output`
WHERE RAND() < 0.2
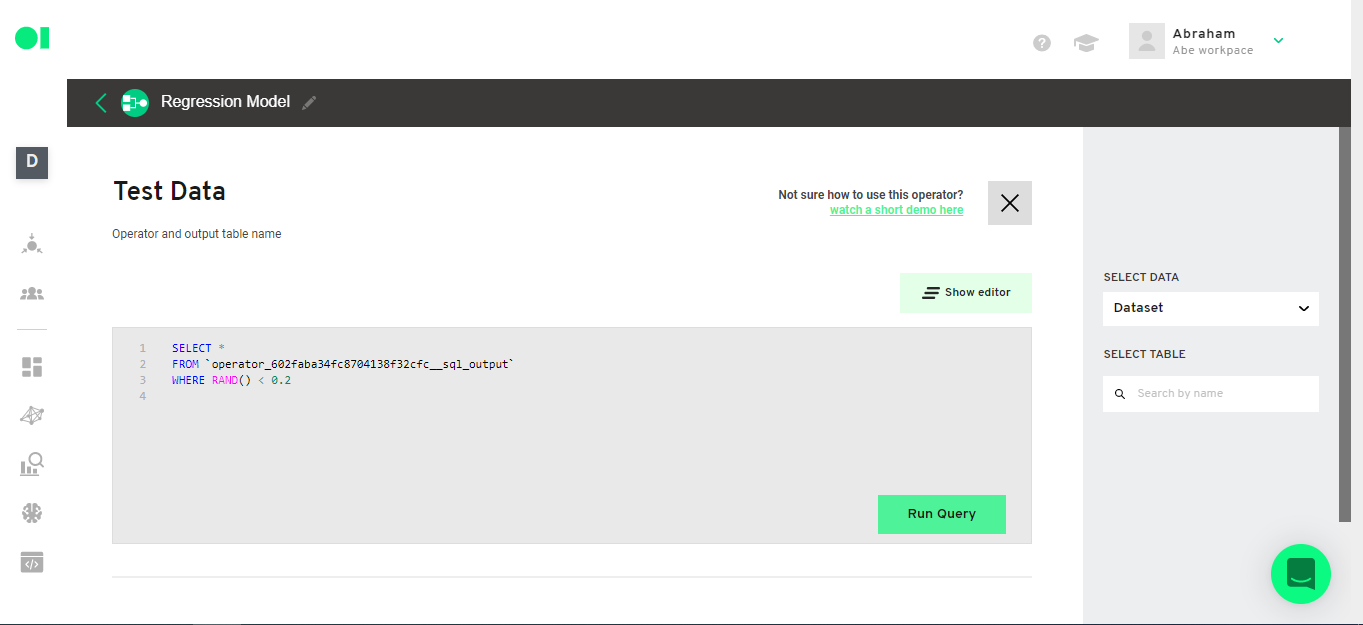
Run the query and save it.

Set up the prediction dataset
Hover over the last SQL element and press the edit button. Select only the 5 last records of the original data set. Copy and paste the following query inside of the SQL canvas.
SELECT *
FROM `operator_602faba34fc8704138f32cfc__sql_output`
ORDER BY ID DESC
LIMIT 5
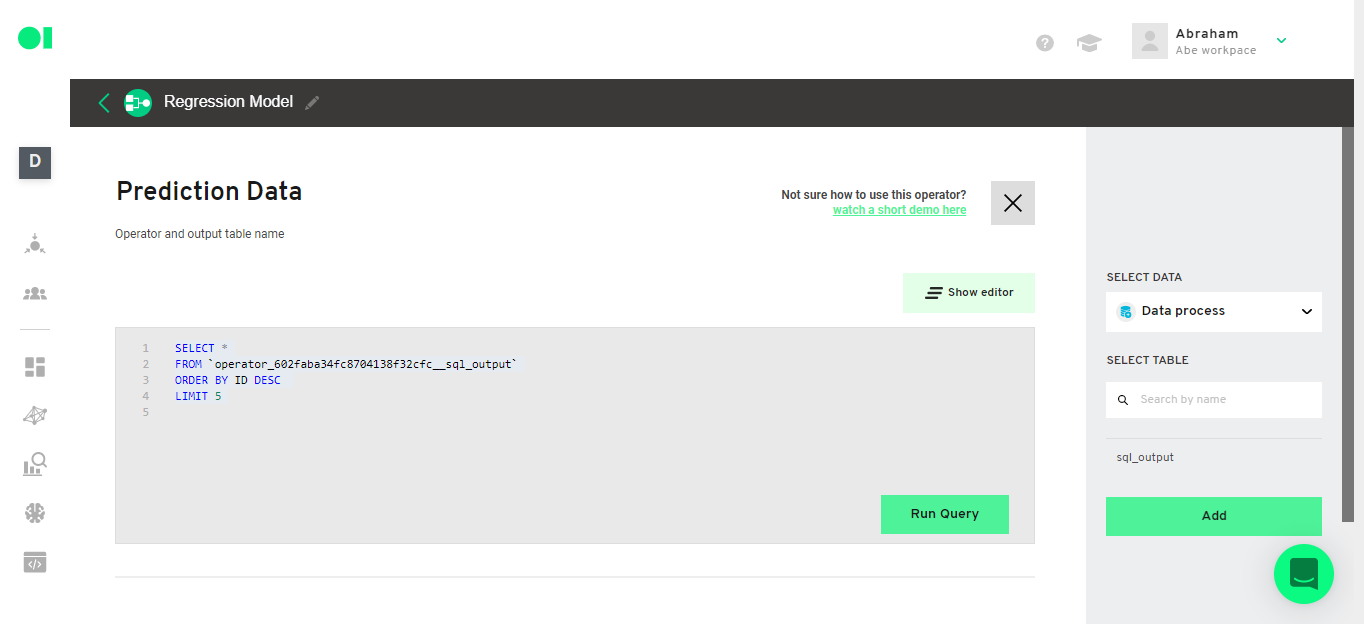
Run the query and save it.
Run all three SQL Operators by hovering over each one and pressing the Play icon. A green checkmark will appear to confirm the process is completed.
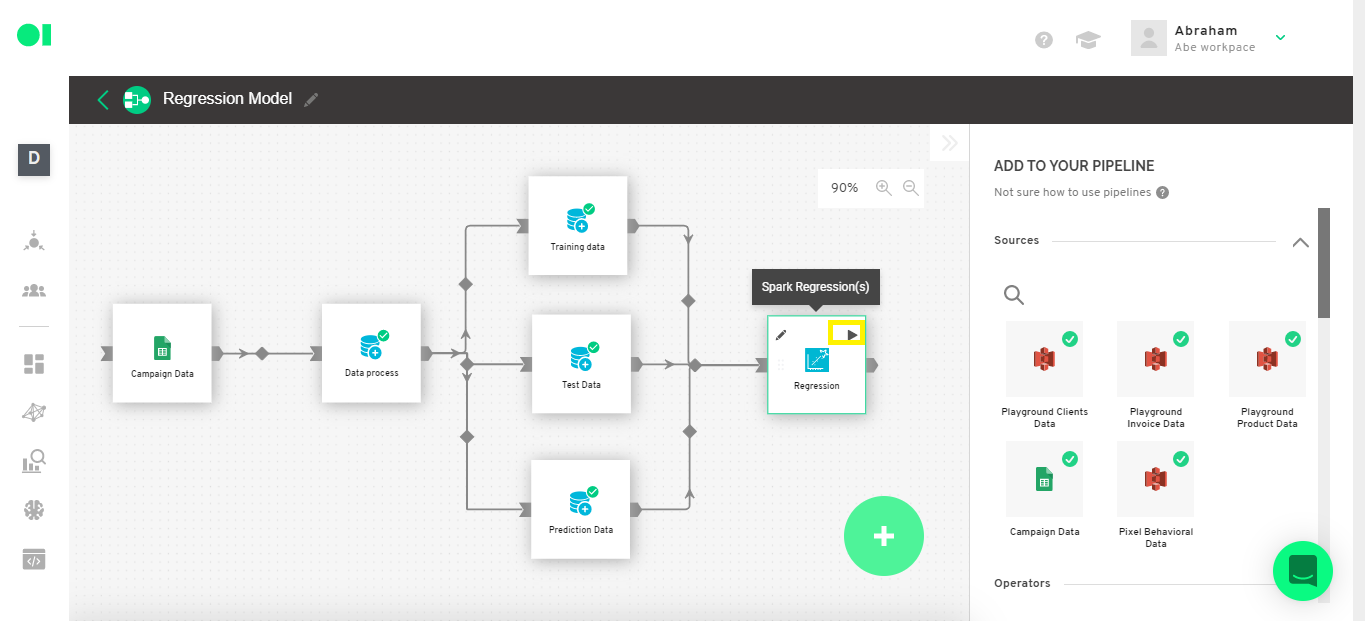
The data is ready to be implemented into the model. Now you must connect a Spark Regression Operator to the three datasets created before. To do so look for the Regression Operator from the right-hand side menu and drag and drop it into the canvas. Then, connect all three SQL operators to it.
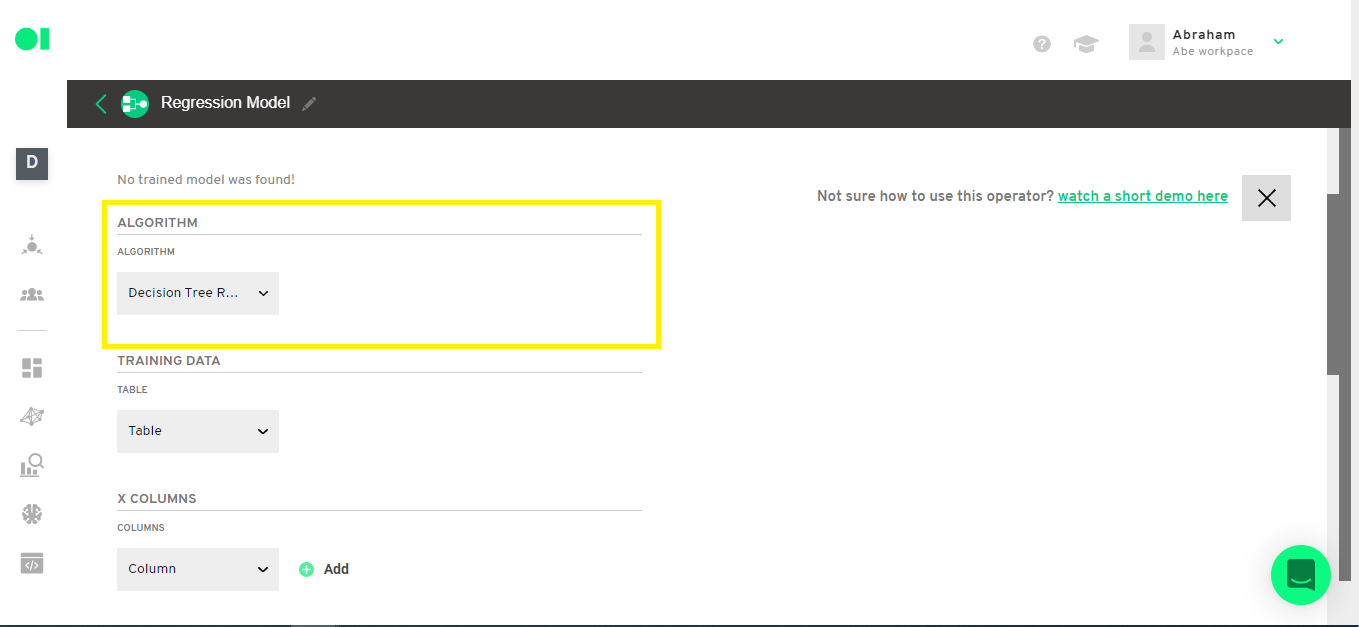
Step 8: Regression Operator configuration
Open the Regression Operator and select which algorithm you will be using. In this example, you will use the Decision Tree Regression Algorithm which will study the correlation between the Spend and Conversions as well as predict the campaign’s conversion based on Ad spend.
Step 9: Regression operator configuration
Select your training data and the columns you are going to use.
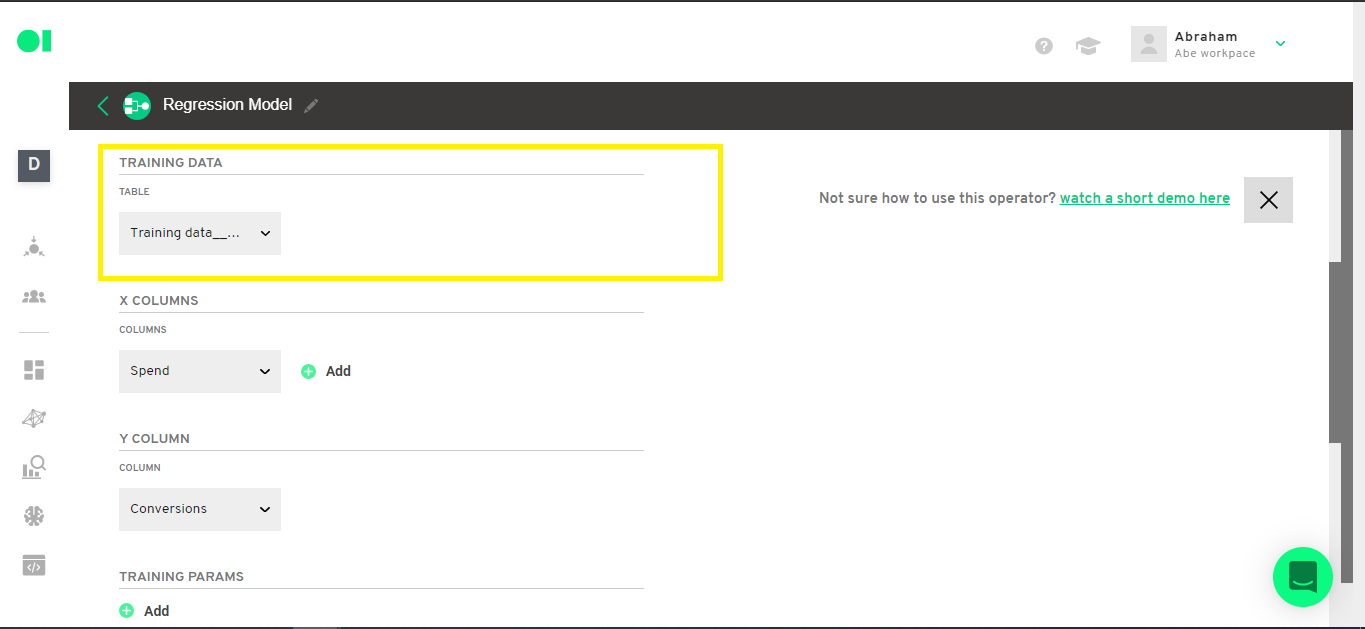
In this example you will use the X column which is the independent variable. In this example this is the Ad Spend.

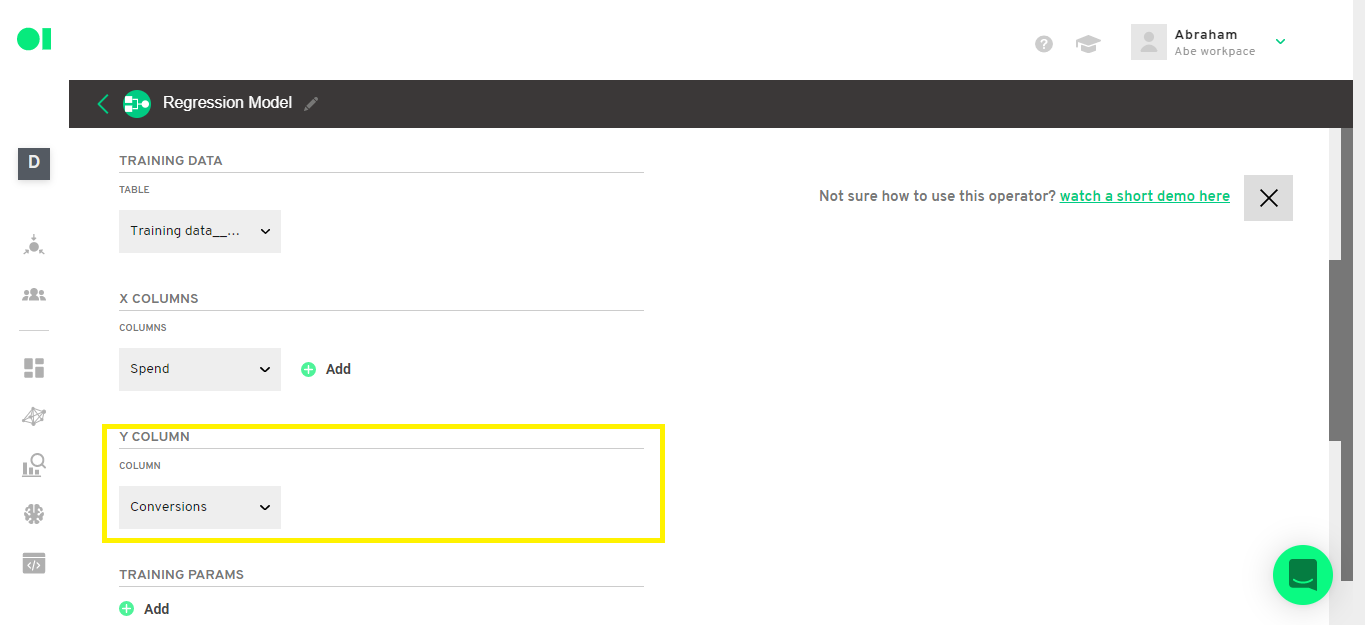
The Y column is the dependent variable which will be the one you want to predict on. In this example, this is the Conversions column.
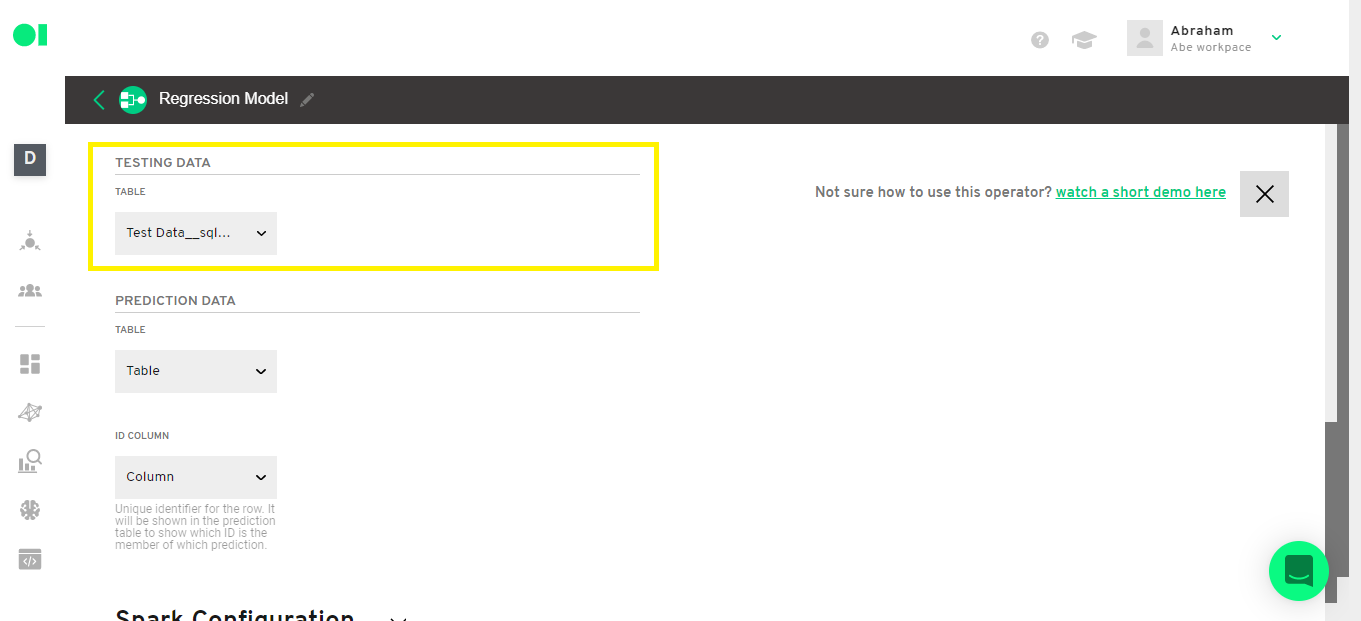
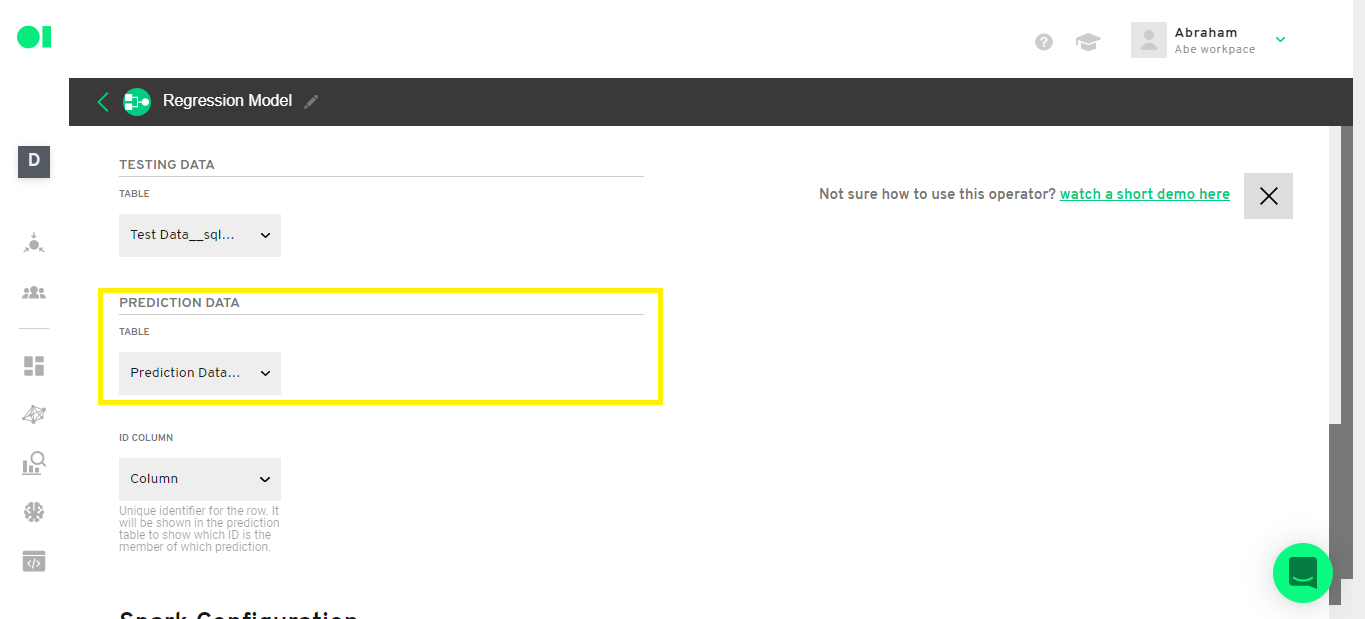
Step 10: Regression operator configuration
Select the Test dataset, Prediction data set and the ID column by expanding the dropdown menus.

Step 11: Regression operator configuration
Select the option to get an email when the Regression Operator is ready and then hit Save.
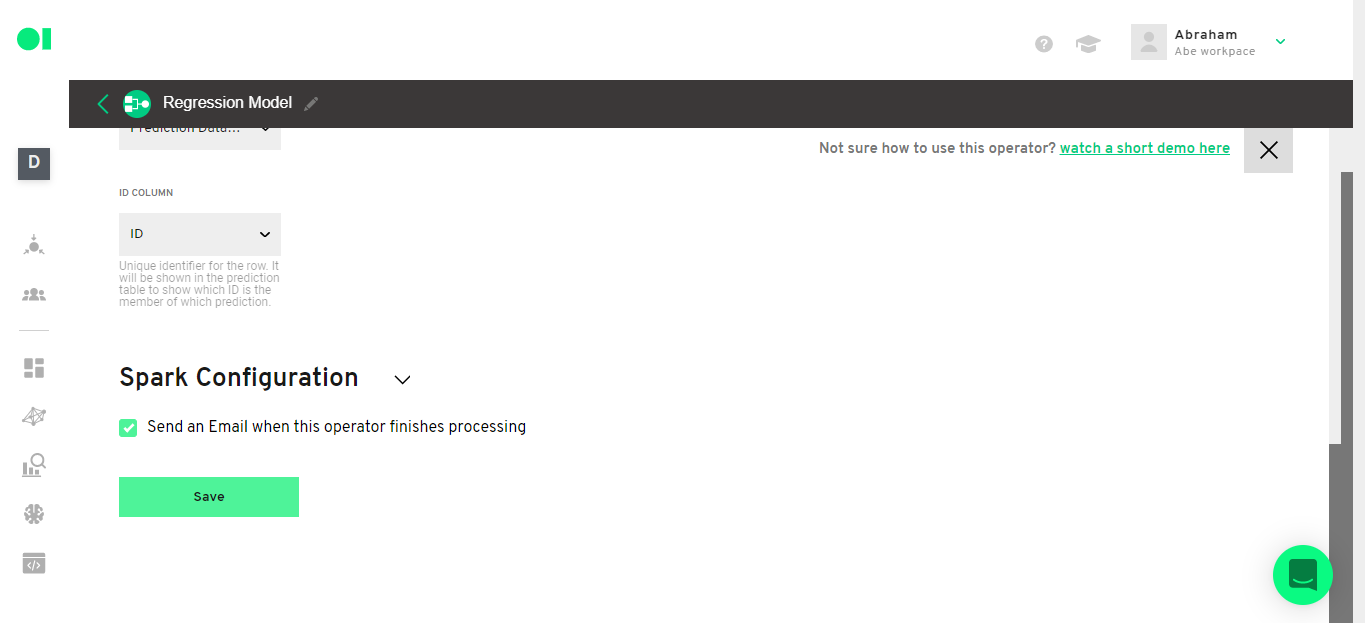
Then run the operator by hovering over the element and clicking on the play icon.
This process may take at least 12 minutes.
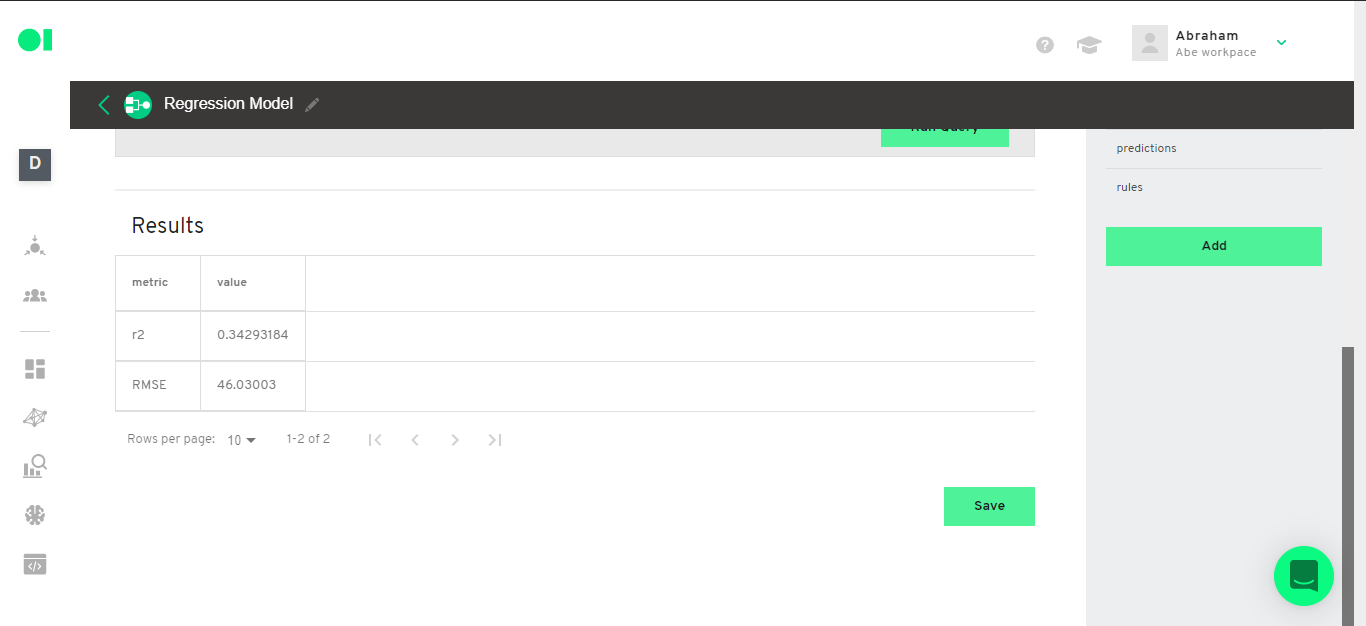
Step 12: First part of the results
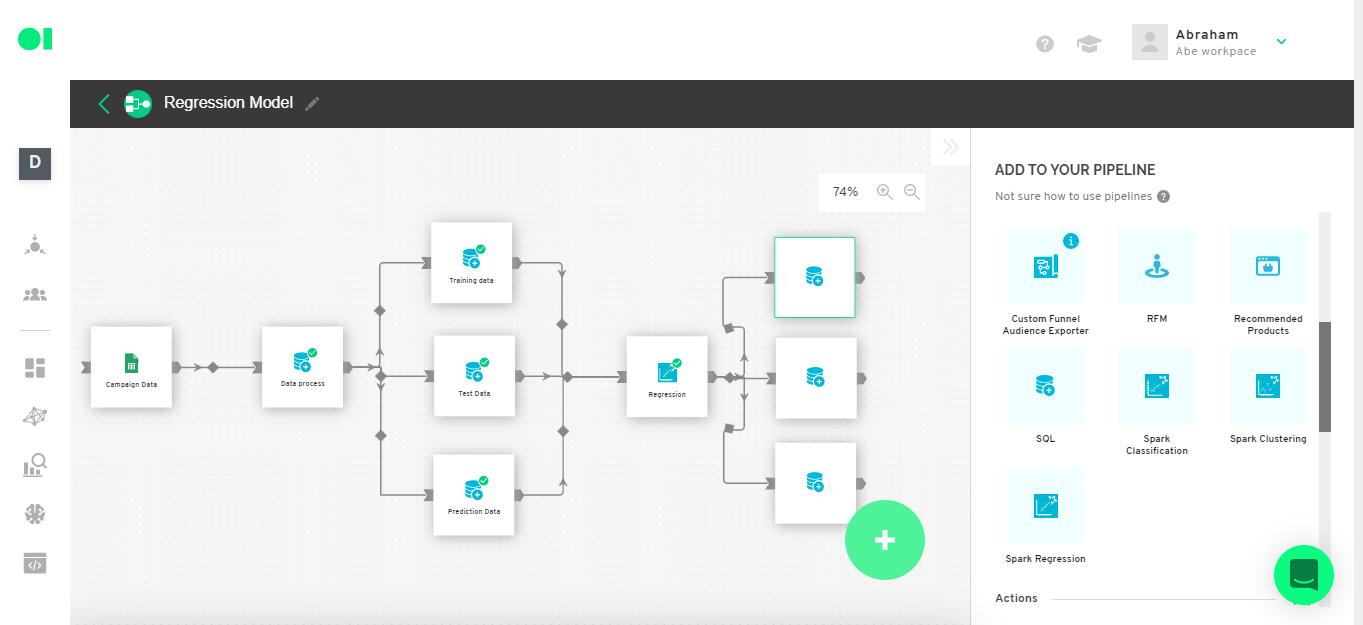
Once the element has completed the run, you can check the performance of your model and the prediction results. To do so, connect three SQL operators to the Regression element. Drag and drop the elements from the right-hand side menu.
Step 12: Second part of the results - Metrics
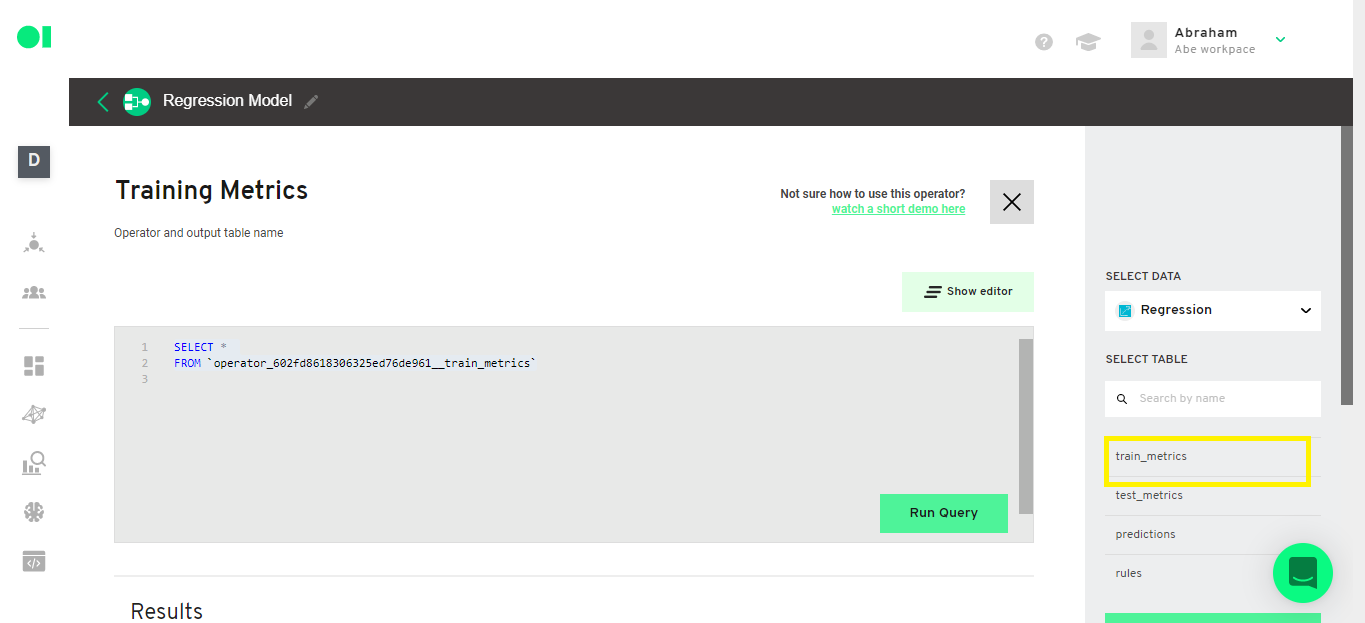
Visualize the Training data and Test data metrics:
Copy and paste the below query to visualize training data metrics.
SELECT *
FROM `[Training metrics section]`
For our example:
SELECT *
FROM `operator_602fd8618306325ed76de961__train_metrics`
Copy and paste the following query to visualize the test data metrics.
SELECT *
FROM `[Test metrics section]`
Use the following query to recreate our example:
SELECT *
FROM `operator_602fd8618306325ed76de961__test_metrics`

Step 13: Third part of the results
Check the predictions the model made. Make a connection between the prediction results and the actual conversions.
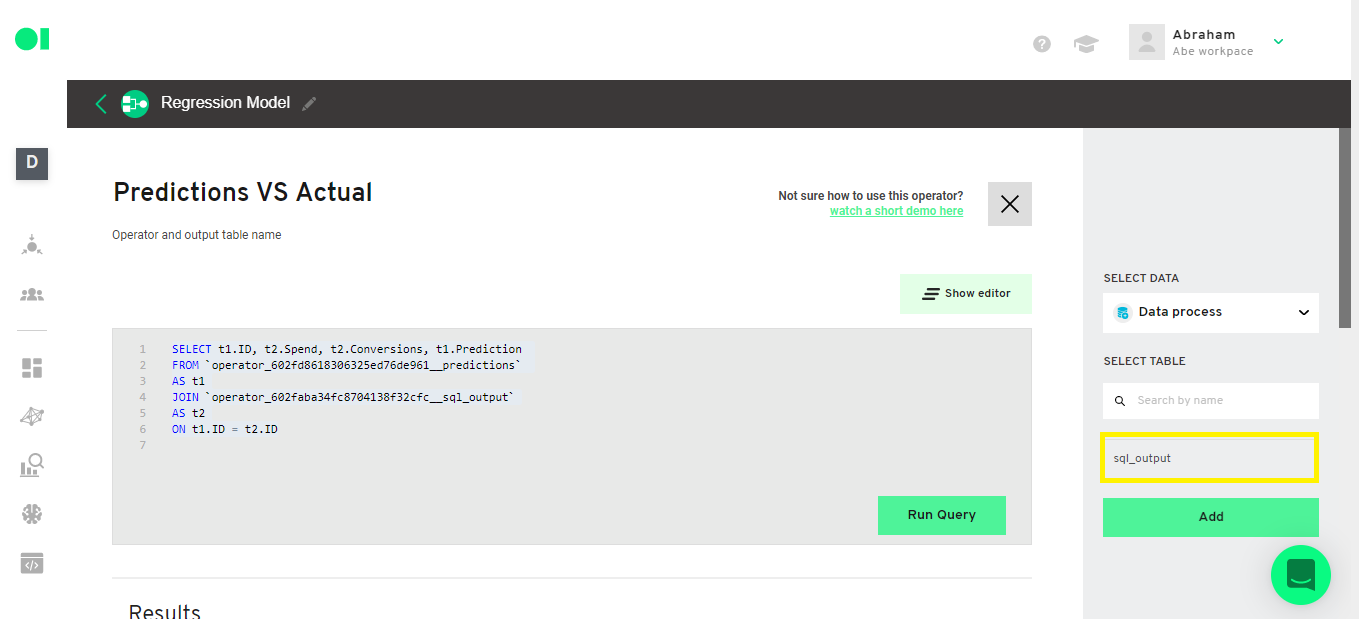
First, connect the original table (Data process) to the SQL Operator.
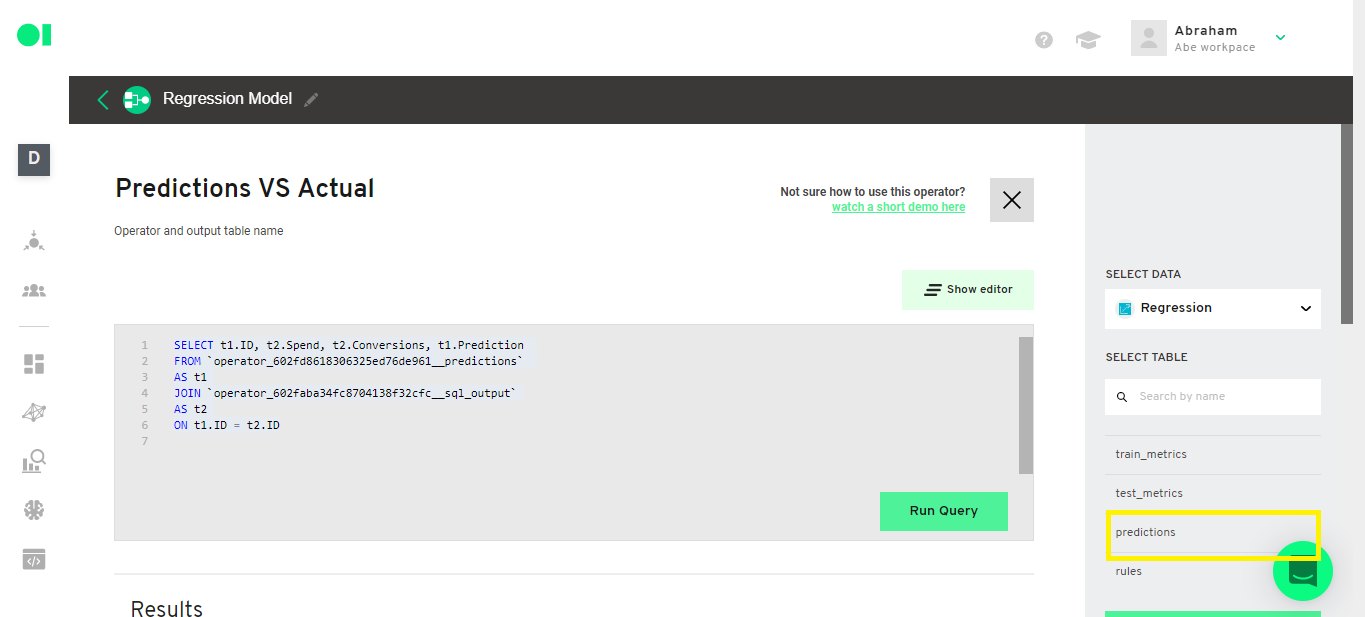
Then, create a query to join the predictions with the actual values. Copy and paste the following query:
SELECT t1.[ID column], t2.[Independent variable], t2.[Dependent variable], t1.[Prediction column]
FROM `[Prediction table]`
AS t1
JOIN `[Original table]`
AS t2
ON t1.[ID column] = t2.[ID column]
To copy our example use this query:
SELECT
t1.ID,
t2.Spend,
t2.Conversions,
t1.Prediction
FROM `operator_602fd8618306325ed76de961__predictions` AS t1
JOIN `operator_602faba34fc8704138f32cfc__sql_output` AS t2
ON t1.ID = t2.ID
Select the Prediction table from the source:
Select the Original table:
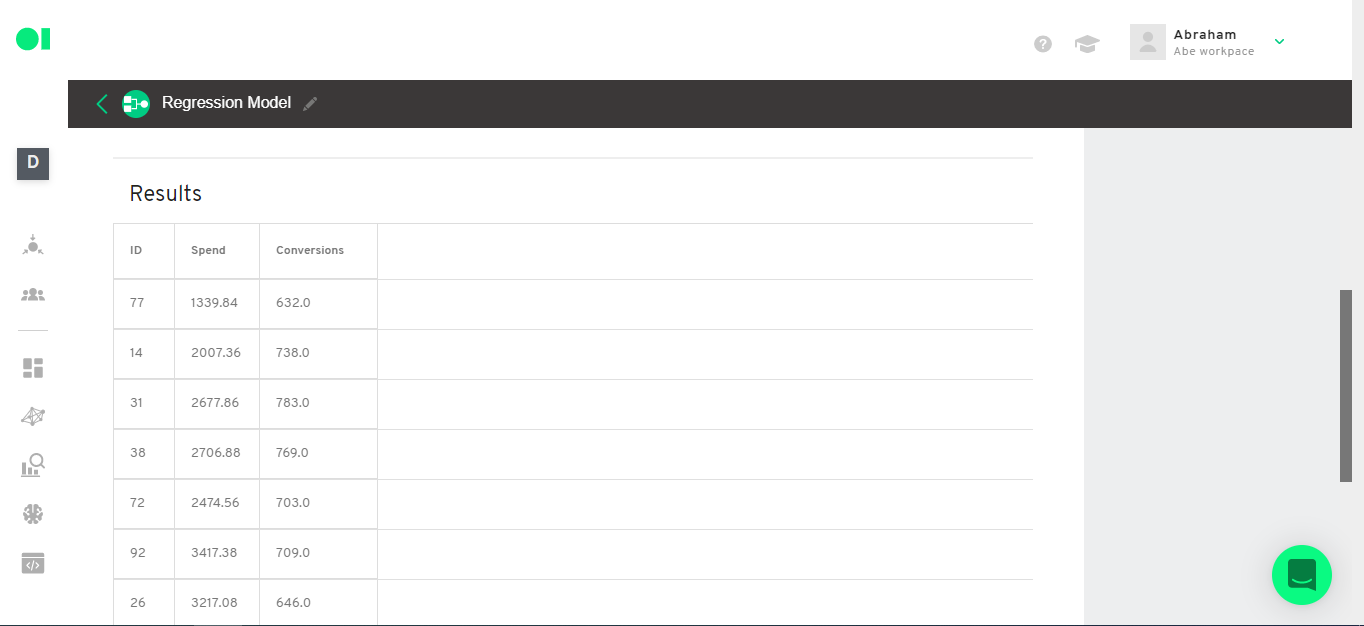
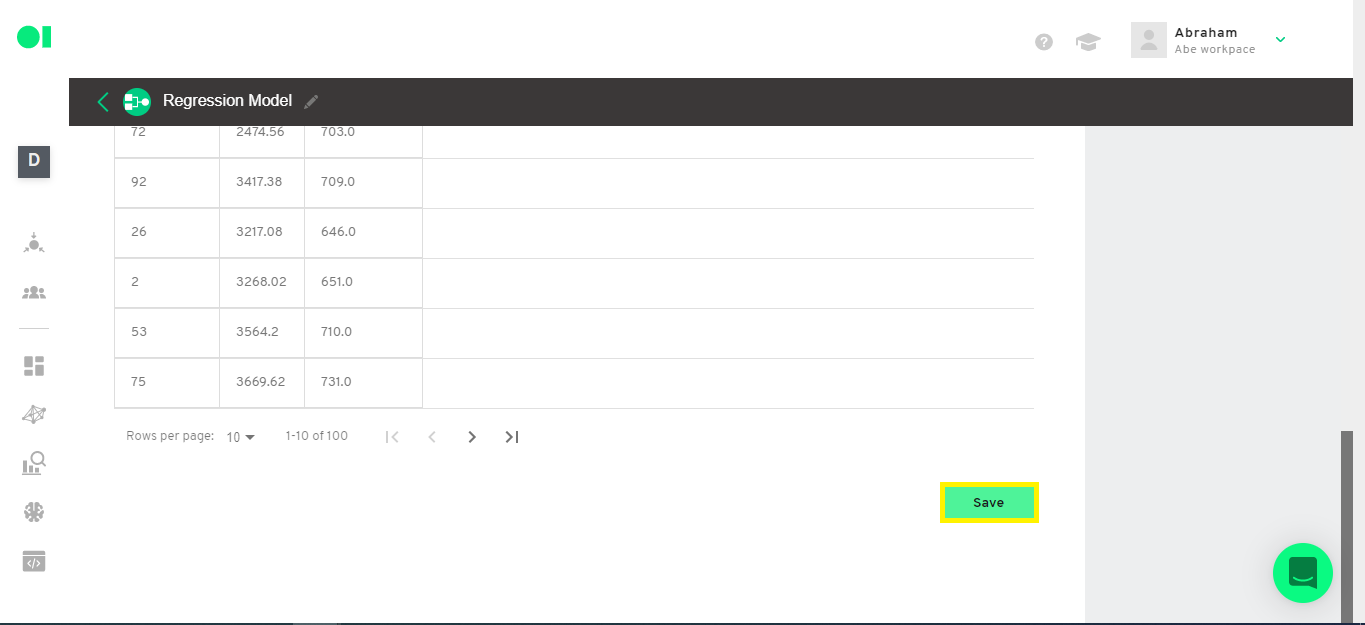
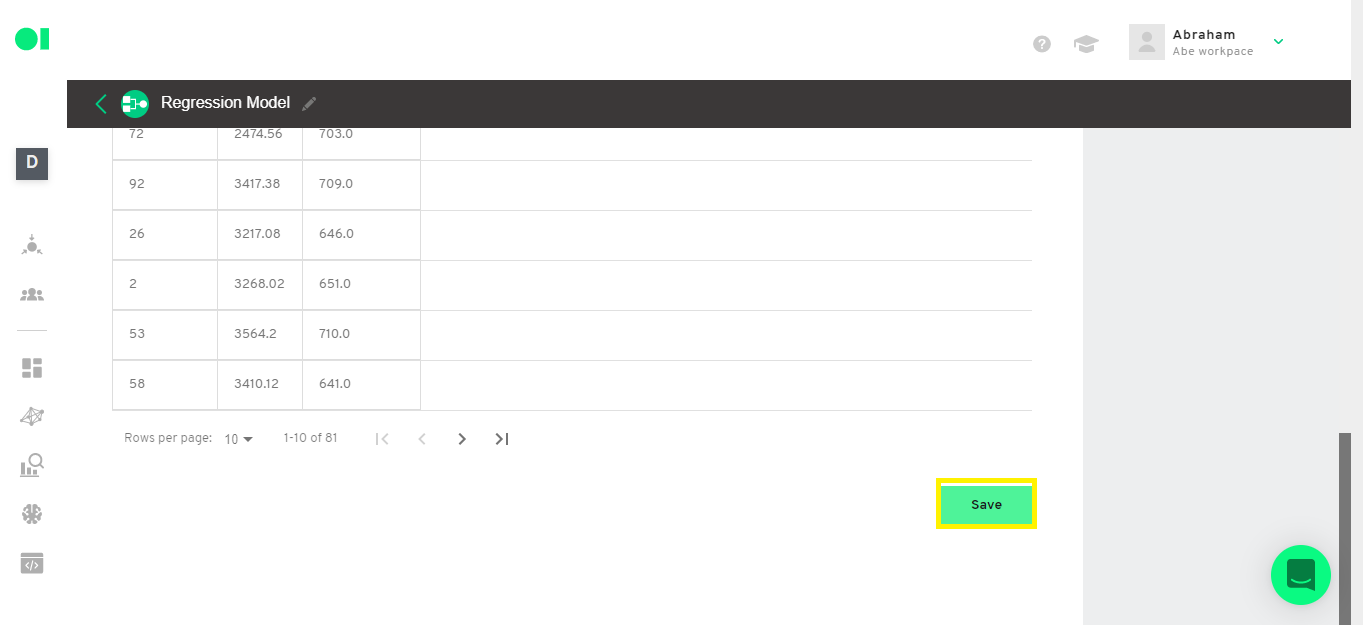
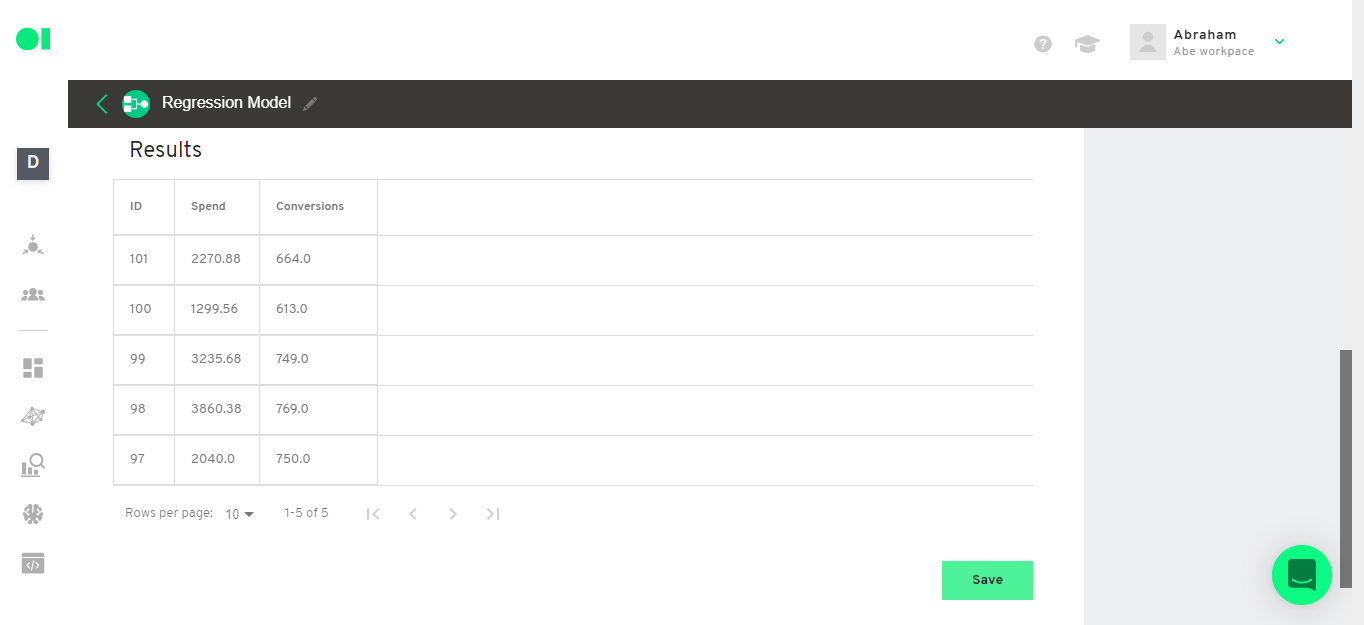
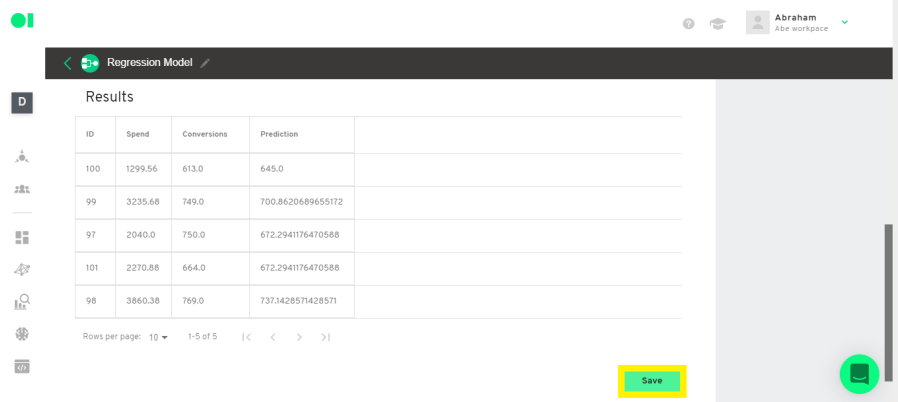
Now, check the results and save the SQL Operator.
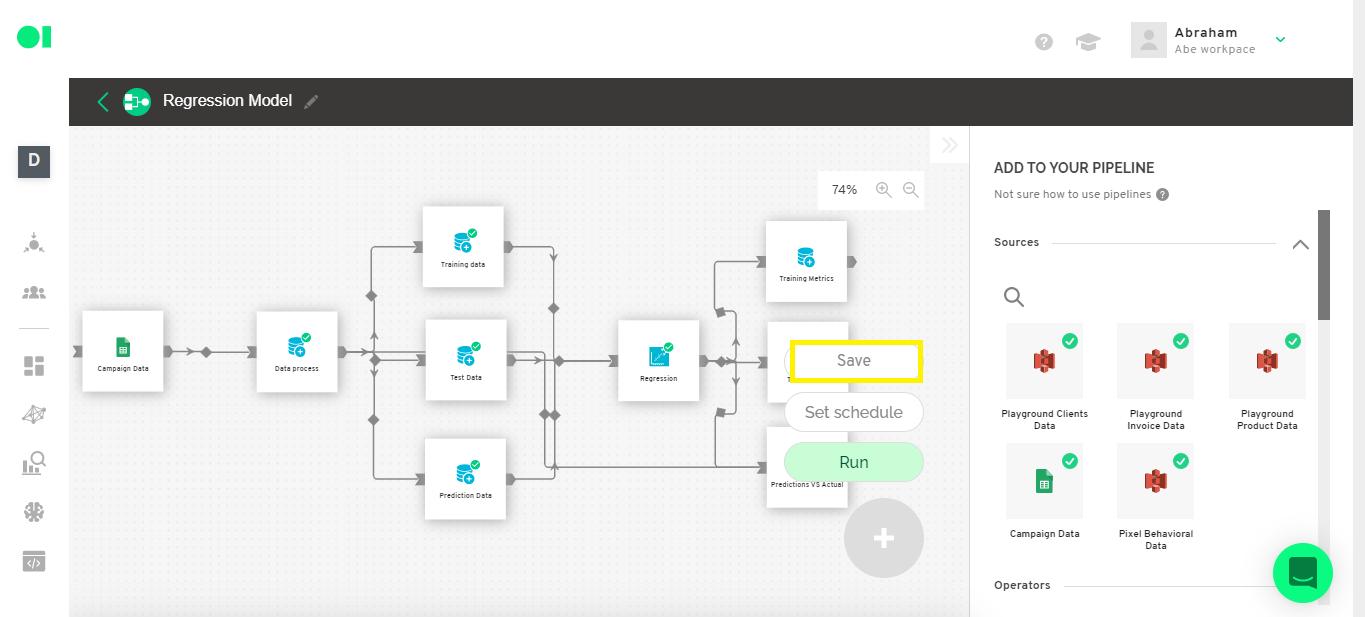
Step 14: Save pipeline
Now we save the Pipeline by clicking on the + symbol and pressing the Save button.
Step 15: Send the outcome to a business application. Connect to actions
You can use any of the actions available in the right-hand side menu by dragging and dropping them to the model results. In this example, you can drag a CSV file Operator to get all the results from the model.
Putting a Regression model results into production gives you the agility needed to act fast without the need to build APIs which could take weeks if not months to complete. Follow this example to predict based on your data, or create more advanced models using Clustering algorithms, logistic regressions and more with Datagran. Learn more about the platform here.

.jpg)

