
Most decision-making is influenced by biases, memories and experiences. We build a scale in our head to weigh in the risks and consequences that a decision’s outcome may have.
Unfortunately, humans aren’t perfectly logical, and a variety of factors can affect our capacity to make the right decisions. Incomplete information, urgency, and lack of manpower and resources can leave us with limited data to evaluate the options. Emotional factors can cloud our judgement and make us choose the unreasonable option despite evidence that favors the other choice. We clearly need better ways to make decisions.
Data driven decision making offers a chance to make decisions purely on the factors that should weigh into the final choice, removed from emotion and feeling. It’s a model that involves collecting information based on KPIs, visualizing it for analysis to gather insights, and using the outcome to build the best possible future based on what the data says.
Here’s how it works.
Decision Making Model
- Data Literacy
Imagine your company’s teams spoke different languages and couldn’t communicate with each other. The result would be a broken workflow and a guessing game of what each one thinks the other one meant. That often is how data feels inside companies. Data from one application may not work with another, and what one team thinks the data means may not line up with what another sees in their tools. Thus the need for data literacy, the ability to read, understand, create, and communicate with data as information. Today’s best organizations should teach data skills almost as a second language to exploit their information and enhance decision making.
In a 2020 Gartner study, data literacy is listed as one of the top roadblocks for data and analytics leaders. “Information as an asset” is a popular idea, but a scarcity of asset management standards, unfamiliarity with data tools, and a lack of experience in finding insights from data prevents teams from driving value from data.
So first, you need to be data literate. You’re most likely already familiar with using spreadsheets, finding average sales data and so on, as well as your team members, but identifying key players in your organization who show interest or have the basics to learn more about data is a great starting point in transforming your company’s culture towards data.
Here are a few suggestions on how to identify key players:
- Identify the people who can read statistical data, interpret percentages, and find correlations and averages.
- Find who can build use cases based on those readings.
- Pinpoint who can communicate the results.
- Determine if your team can interpret ML model results.
- Analyze if your customers are grasping the value behind your outcome.
In order to start teaching data literacy in your organization you must expand your knowledge to learn how to read and analyze different types of information gathered by the systems your company has put in place. Schools and universities focus on core competencies like algebra and calculus, missing much-needed topics like statistics and probability, leaving a wide gap to be filled up. Companies like Adobe and Bloomberg have gone as far as to build in-house academies that teach professionals from all areas to learn how to read and analyze data.
- Set objectives
Then, assess the objectives for the project with clear KPIs (or key performance indicators) which could range from complex goals like identifying waste in a specific way in manufacturing product lines, or as broad as increasing traffic on your website. Select specific KPIs to measure these goals so you know which data analyze, what models to run and how to read the outcome to achieve key business objectives.
Not just any data could help your business. You need to know the type of data that will make an impact, first.
For example EachMile, a non-profit organization focused on transforming the global seafood and agricultural supply chain, set an objective to understand and predict the health of harvested fish to consequently predict the availability in the supply chain. That lets them know what data they’ll need to gather before making decisions.
- Collect data
With the objective in hand, it’s time to gather data. You need to find data from your company, or from outside data sources, that can help you make decisions that meet your objectives. You could have customer information in PayPal and Stripe, website traffic data in Google Analytics, app download numbers from the App Store, and so on.
Once you’ve pulled data from each source, you’ll then need to bring it together. You’ll need to centralize your data into a single system in order to have trusted and clean information to start your analysis. You might have pulled your data from data warehouses, databases, web applications, or even spreadsheets—now you need to standardize the data and make everything line up.
Start by accessing the data that’s the least complex and has the highest value for your objectives, then clean it up into a coherent single data set where everything is in the same fields.You might have customer data from a half-dozen sources, some with the customer name first, others sorted by order ID, others with only an email and purchase price. You’ll need to move the data around until everything fits together.
For a company with the objective of analyzing inventory in real time, say, a good starting point would be to gather data from databases containing product information, and standardizing data from each source so the product name, inventory quantity, and more are in the same fields in every record.
- Run predictive models
Now that you have the data together, it’s time to find what you should do based on the data. Running predictive models with Machine Learning diminishes the risk of making decisions tremendously. They use algorithms to solve specific business problems across a variety of industries like aerospace, energy, financial services, manufacturing, marketing, retail and more. Each algorithm serves a purpose, for example:
Clustering: Customer segmentation, community discernment.
Classification: Customer retention, recommendations.
Regression: Credit scoring system, predict outcomes for specific events.
Find the full list of algorithms offered by Datagran.
Some of the outcomes one could get from predictive models are:
- Sales performance
- Ecommerce activity
- Web analytics
- Lead generation
- Marketing effectiveness and optimization
- Management of customer relationships
- Operational effectiveness and process mapping
- Data discovery
- Human resource analytics
- Inventory management
A Gartner study mentioned that by embedding predictive analysis models into your core strategy, business managers can streamline internal business processes, identify unfolding consumer trends, monitor emerging risks, and build mechanisms for improvement. Driving analytical transformations will, thereby, enable your company to gain a competitive edge and stay at the forefront of digital disruption.
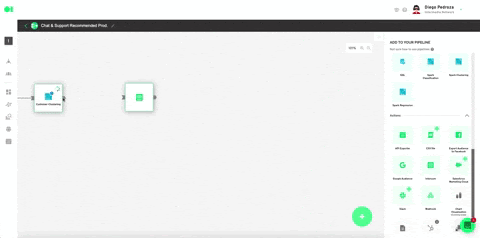
An easy way to do that is with Datagran, which seamlessly integrates data and allows technical and non-technical folks alike to put ML models into production fast, without the need to code. It can help with step 3 too. Datagran's easy-to-use pipeline builder canvas can centralize hundreds of data sources together, and apply machine learning algorithms to your data like RFM, Clustering, and more with a simple drag and drop. Most importantly, you can also send the output to your favorite business software including Intercom, Slack, Salesforce, among others.
You might be able to get the insights you need directly from your data and Datagran’s machine learning models, but often you’ll need to dig a bit deeper both to clean up data from varied sources and to pull several bits of data together. That’s where your data literacy skills will come into play. Datagran’s Custom SQL editor lets you build unique queries to pull out the specific data you need, calculate values, then run machine learning models on the specific information you need.
- Act upon outcomes
Now it’s time to get to work. The outcomes from a predictive model can be mapped out in custom charts for easy visualization. If using Datagran’s platform, outcomes can be sent out to a business application of your liking like Salesforce, Facebook Ads, Intercom, Slack among others, by simply dragging them into your pipeline canvas. Prior to Datagran’s platform, data analysts and scientists had to manually analyze model results, gather insights and send them to production manually, meaning uploading the specific action whether it was targeting potential customers through Facebook Ads, or sending the output to their API and so on. With Datagran, teams can send the outcome of their model to their most used web applications fast, and without the need to code. Here’s a quick pipeline example.
If using charts, you can rest assured they will provide the ease needed for further analysis. They are designed to aid you in presenting a clear look of your outcomes, and come in a variety of easy to read formats such as a bar chart, pie chart, table or pivot.
Taking the results and going back to the objectives will help you give your stakeholders the tools to make effective decisions.

.jpg)

